Project overview
| Industry | Agriculture & Agri-Processing |
| Scale | Multi-region holding, $193 million annual procurement volume |
| Engagement type | Category & cost analysis, spend visibility, ROSMA benchmarking |
| Consulting service | Procurement Consulting & Advisory, Spend Analytics Consulting |
| Frameworks applied | ABC category segmentation, ROSMA benchmark, As-Is / To-Be process mapping |
About the сlient
Our client is a diversified agricultural holding operating farming entities across multiple regional clusters, with a combined annual procurement volume of roughly $193 million spanning fertilizer, crop protection, seed, fuel, spare parts, and services.
Challenge
Before we could recommend where to find savings, we had to establish where the holding’s money was actually going — nearly a fifth (20%) of its spend never touched a procurement specialist, and no one had a category-level view of the rest.
This led to several issues:
- $39,4 million (20% of total spend) was purchased directly by operating departments, bypassing the procurement function entirely
- Procurement reported through two separate management lines, blocking a single, consistent set of standards
- No procurement regulation existed to govern how purchases should be run
- Only 9 procurement specialists managed centralized purchasing across the full holding
- Supplier proposals were evaluated manually in spreadsheets, with no consistent scoring method
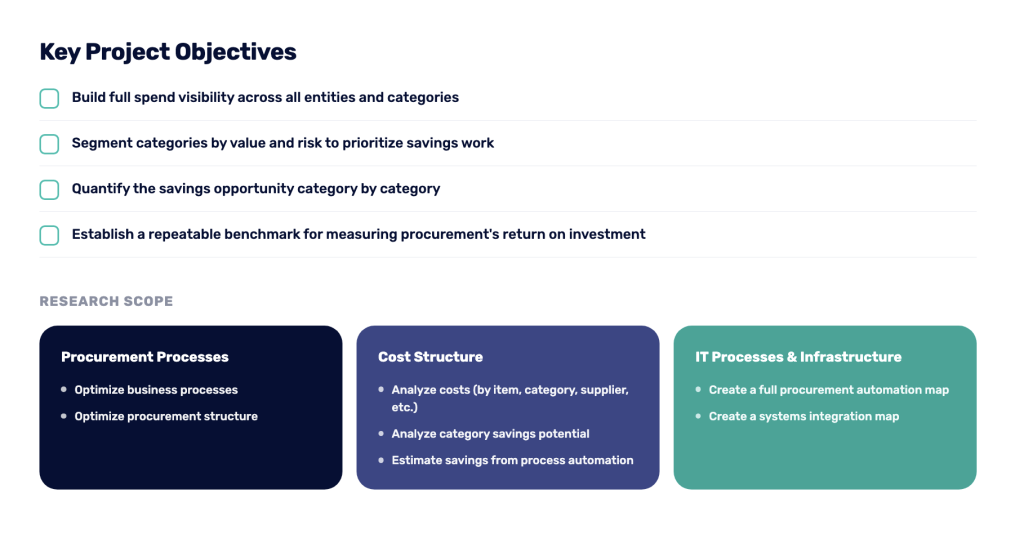
Key project objectives included:
- Build full spend visibility across all entities and categories
- Segment categories by value and risk to prioritize savings work
- Quantify the savings opportunity category by category
- Establish a repeatable benchmark for measuring procurement’s return on investment
Our сonsulting approach
Our spend analytics team built a category-and-cost analysis from the client’s own transaction data, then applied our ABC segmentation and ROSMA benchmarking methodology to turn that visibility into a quantified savings plan:
- Spend visibility — consolidated transaction data across the holding’s full procurement volume, uncovering the $39,4 million running outside procurement’s view
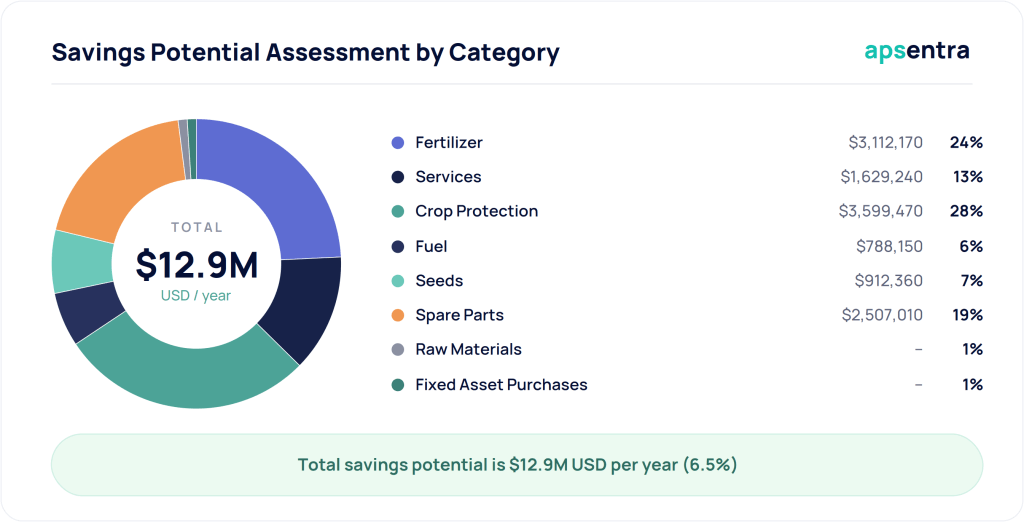
- ABC category segmentation — grouped roughly 20 spend categories into A/B/C tiers by value concentration, identifying that six categories (fertilizer, services, crop protection, fuel, seed, spare parts) drove 96% of total spend
- Savings quantification — a category-by-category savings model combining single-round reduction effects, multi-round tender effects, and process-efficiency effects into one reconciled number
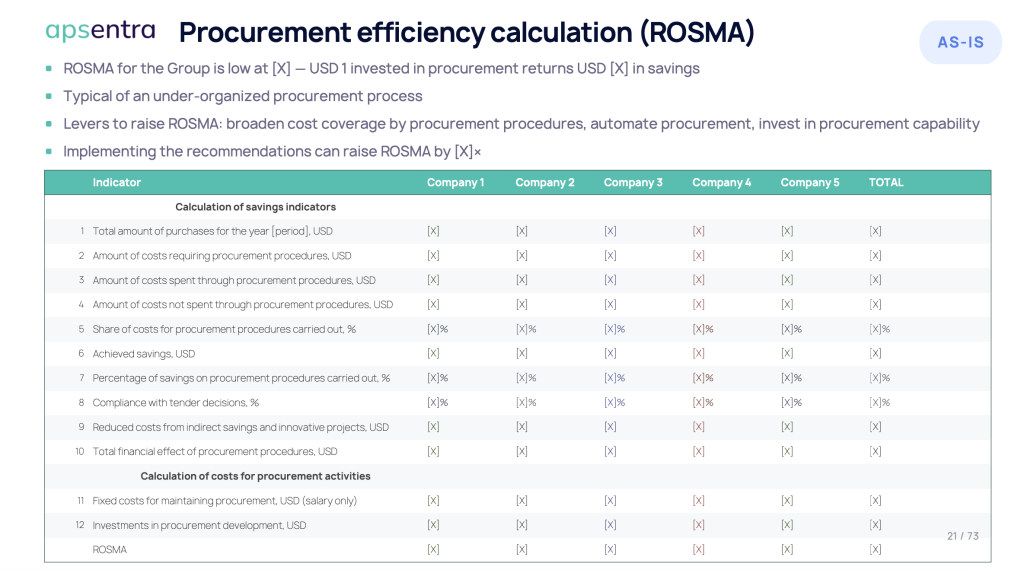
- ROSMA benchmarking — calculated the holding’s return on spend management activity, quantifying how much value each dollar invested in the procurement function returns
- Target operating model — a single procurement reporting line and a formal procurement regulation, replacing the two-vertical structure
- Automation roadmap — a systems plan for requisition, tendering, contracting, and order management, with multi-round tenders and reverse auctions for standardized categories
Deliverables
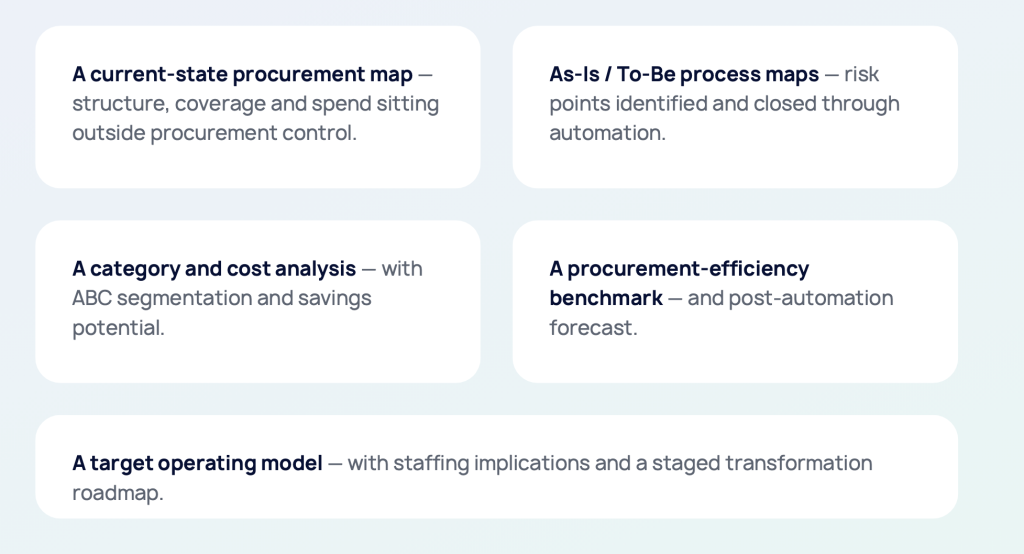
- Consolidated spend visibility report across all entities and categories
- ABC category segmentation
- Category-by-category savings model
- ROSMA benchmark and target
- Target operating model with a single reporting line
- Procurement automation roadmap
Results

$12,9 million in identified annual savings potential

A ROSMA of 14.8

Six categories mapped to 96% of spend

Requisition processing time cut by up to 50%

Tender processing time cut by up to 90%
Business impact
Bringing the 20% of “invisible” spend into view, and segmenting the rest with ABC analysis, gave our client the leadership position in a category-by-category map of where savings were realistically achievable, not a generic benchmark, but a number built from the holding’s own purchasing data.
The ROSMA framework (Return on Supply Management Assets) to count business efficiency now gives the board an ongoing way to measure whether the procurement function is paying for itself, quarter over quarter.