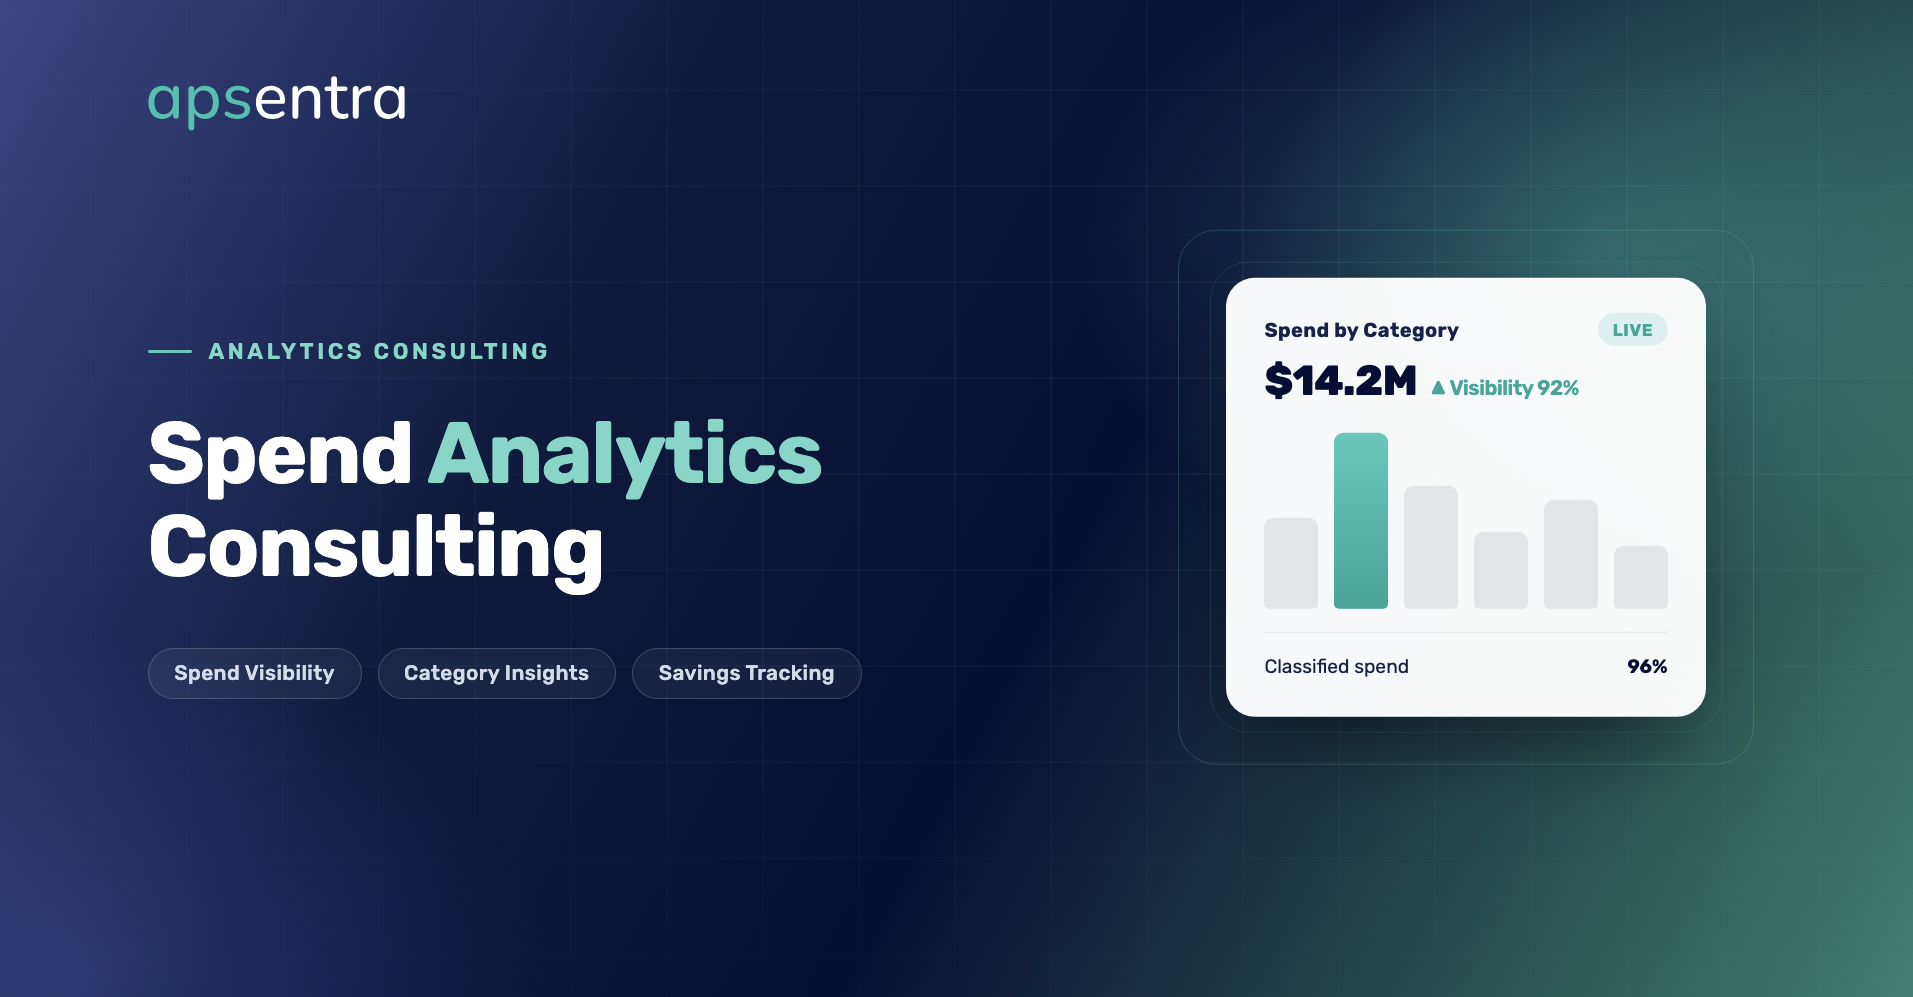
Spend Analytics Consulting: Turning Transaction Data Into Strategic Intelligence
That’s the problem spend analytics consulting exists to solve: turning fragmented, unstructured transactional data into structured intelligence that actually informs a sourcing decision. What used to be a periodic, manual research exercise has become — for organizations doing it well — a continuous, largely automated intelligence layer sitting underneath every procurement decision the business makes.
What Spend Analytics Consulting Actually Does
At its core, spend analytics consulting establishes complete visibility into what an organization actually buys, from whom, at what price, and how consistently. That sounds simple. In practice, most organizations discover that without a standardized structure for categorizing spend, cross-functional comparison is close to impossible — the same category of purchase might be labeled a dozen different ways across business units, making it look like several small, unrelated expenses instead of one meaningful category worth negotiating as a whole.
Getting this right is what enables everything downstream: strategic sourcing based on real numbers instead of assumptions, savings tracking that holds up under scrutiny, supplier base consolidation, and — ultimately — procurement decisions that connect directly to the company’s actual P&L rather than living in a disconnected reporting exercise.
Key Takeaway
Spend visibility isn’t a reporting nicety — it’s the prerequisite for every downstream sourcing, savings, and risk decision procurement makes.
The Foundation: Building a Spend Taxonomy That Actually Works
Every credible spend analytics engagement starts with taxonomy — a hierarchical classification system that organizes spend from broad executive-level categories down to granular, sourceable line items. Get the taxonomy wrong, and every analysis built on top of it inherits the same flaws.
Effective taxonomies typically run three to four levels deep — deeper than that tends to create more granularity than anyone can actually act on, and more opportunities for miscategorization:
| Level | Focus | Indirect Spend Example | Direct Spend Example |
|---|---|---|---|
| 1 — Spend Group | Executive-level reporting; direct vs. indirect split | Professional Services | Direct Materials |
| 2 — Category Group | Portfolio management, supplier consolidation | Corporate Legal Services | Machined Components |
| 3 — Subcategory | The level a strategic RFP actually gets built at | External Counsel — Litigation | CNC Aluminum Components |
| 4 — Commodity/Part | Tactical price-variance and SKU-level analysis | Intellectual Property Law Services | Specific extruded aluminum profiles |
Two design principles separate a taxonomy that works from one that quietly undermines every analysis run on top of it:
- MECE — mutually exclusive, collectively exhaustive. Every transaction should belong to exactly one category (no double-counting the same spend across overlapping buckets), and every transaction should have a home somewhere (no “Other” or “Miscellaneous” catch-all — a catch-all bucket is usually a sign the taxonomy design was never finished).
- Structure around the external market, not internal accounting. This is the mistake that trips up more taxonomy projects than any other: building category structures around business units, departments, or internal cost centers instead of around what was actually purchased from the supply market. Organizational attributes like business unit or cost center belong as secondary metadata tags, not as the backbone of the taxonomy itself.
It’s also worth distinguishing generic from custom taxonomies. Standard frameworks like UNSPSC or eClass work reasonably well for indirect spend — IT hardware, facilities, professional services — where purchasing patterns are broadly similar across industries. Direct spend is a different story: specialized manufacturing components and raw materials usually need a custom hierarchy that reflects your actual bill-of-materials structure and supply market mechanics, because a generic taxonomy simply wasn’t built with your specific supply chain in mind.
Key Takeaway
Build the taxonomy around what you buy, not who bought it. A taxonomy mapped to your org chart will hide consolidation opportunities that a market-based taxonomy reveals immediately.
From Annual Reports to Continuous Intelligence
Spend analytics used to be a periodic engagement: bring in advisors once a year or so, extract historical ERP data, apply manual spreadsheet mapping and rule-based logic, and deliver a static report. By the time that report reached the CPO’s desk, the underlying data was often already stale.
| Dimension | Legacy Model | Modern AI-Powered Model |
|---|---|---|
| Cadence | Annual or project-based snapshots | Continuous, real-time processing |
| Mechanism | Manual spreadsheets and static rules | Machine learning, NLP, AI agents |
| Coverage/accuracy | Roughly 60–80%, weak on tail spend and card data | Commonly 90%+ first-pass accuracy across data types |
| Analyst hours per cycle | Several hundred | A fraction of that, mostly exception review |
| Adaptability | Rigid — new categories require re-engagement | Dynamic, taxonomy-agnostic re-classification |
| Time to impact | Months | Weeks |
The accuracy gap matters more than it might seem. Traditional rules-based engines — matching general ledger codes and vendor names against rigid if-then logic — tend to top out well short of full coverage, and they particularly struggle with messy, unstructured data: corporate card line items, dense professional-services invoices, expense reports, and the long tail of low-value, high-volume spend that’s genuinely hard to categorize by rule. That’s exactly the spend most likely to be miscategorized or simply left unclassified under a legacy approach — which means it’s also the spend most likely to hide real savings opportunities nobody’s ever looked at.
Key Takeaway
The gap between legacy and modern classification isn’t just speed — it’s coverage. The spend a rules engine can’t classify is usually the spend with the most unexamined savings.
How Modern Classification Actually Works
A modern spend analytics pipeline typically runs through four stages.

Automated ingestion

Vendor and description normalization

Automated mapping

Human-in-the-loop governance
The practical effect is that spend classification stops being a periodic data-hygiene chore and becomes a live intelligence layer feeding directly into sourcing decisions, intake orchestration, and real-time budget oversight.
The Financial Case: What Spend Analytics Actually Returns
The commercial case for spend analytics rests on a fairly direct chain of logic: without systematic visibility, sourcing strategy runs on assumptions, and unvalidated assumptions produce missed savings targets.
The Hackett Group’s 2025 Digital World Class® Procurement research found that purchased cost savings average 3.7% of spend per year among organizations with low spend visibility, rising to 4.8% among those with high visibility — and that superior spend transparency and contract compliance among top-performing procurement teams translates into roughly 60% less savings lost to maverick buying and noncompliance (The Hackett Group). That gap comes specifically from better categorization and visibility, before any actual sourcing negotiation even happens.
A related and arguably more important number comes from McKinsey’s research into procurement transformation: the average savings pipeline loses roughly one-third of its estimated value in the planning stage and another 20% during execution, meaning a substantial share of the savings a sourcing team negotiates on paper never shows up in the actual P&L.
That leakage is eroded over time by maverick purchasing outside the negotiated contract, supplier price drift that nobody caught, invoice pricing errors, and general non-compliance. Continuous spend analytics is specifically designed to help close that gap by running an ongoing audit loop between what was actually negotiated and what’s actually being invoiced — catching the leakage as it happens instead of discovering it a year later during a contract review.
A few broader procurement benchmarks help put spend analytics in context alongside other levers:
| Initiative | Typical Benchmark Range | Mechanism |
|---|---|---|
| Structured sourcing programs | ~9–12% cost reduction | Category management, competitive RFPs, TCO modeling |
| Supplier base consolidation | ~10–15% cost reduction | Aggregating volume for tier-based pricing |
| Non-core activity outsourcing | ~15–20% savings | Shifting non-strategic spend to managed providers |
| Categorization coverage | ~80–90% minimum | Threshold needed to eliminate blind spots |
| Classification accuracy | ~90–97% first-pass | AI-driven categorization vs. manual review |
A note on these ranges
The benchmark ranges above are aggregated from publicly published third-party research (cited by source and date throughout this article), not from a single proprietary APSentra study. Actual results vary meaningfully by industry, spend base size, starting data quality, and how aggressively an organization acts on the resulting visibility — treat these as directional context for planning discussions, not a guarantee.
One frequently cited real-world example: industrial manufacturer Pentair deployed an AI-driven spend analytics platform (Sievo) across its international operations and reached over 90% categorization accuracy within roughly two months — and by using that new visibility to spot payment-term inconsistencies across identical suppliers and business units, standardized terms in a way that generated a reported $15 million in working capital improvement, alongside freeing up capacity for further strategic sourcing work.
As with any vendor-published case study, treat the specific figures as one company’s reported outcome rather than a guaranteed benchmark — the value drivers (accuracy, speed to value, payment-term standardization) are nonetheless representative of what a well-run deployment can surface.
Key Takeaway
Spend analytics pays back in two distinct ways: incremental savings from better categorization and visibility, and leakage prevention — keeping the savings that were already negotiated from evaporating before they hit the P&L.
Common Implementation Failures — and How to Avoid Them
Most spend analytics initiatives fail for a small, recurring set of reasons. Recognizing them in advance is usually cheaper than discovering them mid-deployment:
- Taxonomy built around the org chart, not the supply market. The single most common failure. It makes consolidation opportunities invisible because the same category is scattered across business-unit buckets.
- No executive sponsor for data governance. Without someone senior accountable for taxonomy discipline and vendor-master hygiene, classification quality decays within a few quarters as new suppliers and categories get added ad hoc.
- Treating it as a one-time project instead of a live capability. A static report is stale the day it’s delivered. If the roadmap ends at “go-live” with no plan for ongoing tuning, the tool degrades into a dashboard nobody trusts.
- Ignoring the long tail. Teams often accept 70–80% coverage and declare victory, leaving exactly the messy, low-value, high-volume spend where hidden savings tend to live unclassified.
- No change management or category-manager buy-in. If the category teams who’d act on the insights weren’t involved in taxonomy design, adoption stalls regardless of how accurate the underlying data is.
- Confusing classification accuracy with classification usefulness. A 95%-accurate taxonomy that still mirrors internal cost centers is technically correct and strategically useless — accuracy is necessary but not sufficient.
- No connection to execution systems. Insights that don’t flow into intake orchestration, contract compliance monitoring, or sourcing pipelines stay theoretical — an interesting chart instead of a captured saving.
Beyond Cost: Spend Analytics for ESG and Risk
Spend analytics has expanded well past pure cost reduction into a genuinely multidimensional tool — financial, operational, geographic, environmental, and risk data layered on the same underlying spend cube.
Scope 3 carbon accounting is a good example of why this matters. Since most suppliers — especially further down the supply chain — don’t reliably report their own emissions data, spend-based carbon accounting has become a practical way to estimate a supply chain’s footprint anyway: mapping transaction-level spend against environmentally-extended input-output models and category-specific carbon intensity factors to estimate emissions by category and supplier tier.
Platforms in this space, including McKinsey’s Spendscape, let sustainability and procurement leaders identify which categories of spend are actually driving the bulk of supply-chain emissions, model what switching to lower-carbon alternatives would look like, and prioritize which suppliers are actually worth a decarbonization conversation, rather than guessing.
Predictive risk analytics applies the same underlying data in a different direction — cross-referencing your taxonomy against external signals like supplier financial health, geopolitical instability in a supplier’s region, and trade-policy shifts, often layered on top of Kraljic-style segmentation to flag which single-source or bottleneck categories are genuinely exposed. Rather than reacting to a disruption after it happens, procurement teams can use this to make deliberate calls in advance — building buffer stock, qualifying a second supplier, or exploring near-shoring for the categories that carry the most concentrated risk.
Key Takeaway
The same spend cube that surfaces cost savings also powers Scope 3 estimation and supplier risk flagging — one data foundation, three distinct use cases.
Who Delivers Spend Analytics Consulting
The market splits fairly cleanly into two camps. Strategy consultancies and category specialists — including McKinsey (with its Spendscape platform), Kearney, GEP, Bain & Company, and The Hackett Group — pair spend analytics with broader strategic advisory: cost transformation, operating model redesign, and Scope 3 decarbonization programs, often as one piece of a larger engagement. The Hackett Group’s acquisition of the research platform Spend Matters has also given it a benchmarking angle, comparing client performance against what it calls “Digital World Class” procurement metrics.
Specialized SaaS platforms — names like Suplari, Sievo, SpendHQ, Spendcraft, Spendata, Spendkey, and SpendQube — take a different approach: cloud-native tools built for continuous operation, with flexible custom taxonomies and self-serve drill-down analysis, designed to reduce how much ongoing external advisory support you actually need once the platform is live.
Decision Guide: Consulting-Led vs. Software-Led
| Question | Favors a Strategy Consultancy | Favors a Dedicated SaaS Platform |
|---|---|---|
| Is spend analytics one piece of a bigger engagement? | Yes — operating-model redesign, multi-year sourcing strategy, Scope 3 program | No — spend visibility is the whole ask |
| Internal analytics capability? | Limited; need advisory horsepower alongside the tool | Category managers can self-serve once trained |
| Urgency vs. depth trade-off | Comfortable with a longer, more strategic runway | Need continuous, self-serve visibility fast |
| Budget model | Advisory fees layered on top of any platform cost | Primarily subscription/license cost |
| Ongoing support need | Want an advisor relationship that persists post-launch | Want to reduce dependency on external advisors over time |
Which camp makes sense depends on what you’re solving for. If spend analytics is one piece of a larger operating-model or sourcing-strategy engagement, a strategy consultancy’s integrated approach may be the better fit. If the core need is simply continuous, self-serve visibility that your own team can act on daily, a dedicated platform is often the faster and more cost-effective path.
A Practical Deployment Roadmap
Most successful deployments — whether led by a consultancy or a software platform — follow a similar four-phase structure over roughly eight weeks:
Phase 1 — Data ingestion and pipeline setup (weeks 1–2):
Phase 2 — Taxonomy customization and engine tuning (weeks 3–4):
Phase 3 — Parallel validation and exception tuning (weeks 5–6):
Phase 4 — Go-live and continuous value realization (weeks 7–8 and ongoing):
Where Does Your Organization Sit? A Spend Analytics Maturity Model
| Stage | Data & Taxonomy | Classification | Typical Outcome |
|---|---|---|---|
| 1. Ad Hoc | Fragmented spreadsheets; no shared taxonomy | Manual, inconsistent, done for one-off reviews | No reliable answer to “what do we spend with X?” |
| 2. Foundational | Single taxonomy exists; adopted by some categories | Rules-based, periodic, ~60–80% coverage | Annual static report; stale by delivery |
| 3. Managed | Market-based taxonomy; governed centrally | AI-assisted with human review; 90%+ coverage | Continuous dashboards; category teams act on flags |
| 4. Optimized | Taxonomy extends to ESG, risk, contract data | Live, self-improving classification loop | Analytics drives sourcing, compliance, and risk decisions directly |
Getting the Most From a Spend Analytics Investment
Three practical principles separate spend analytics investments that actually pay off from ones that end up as an expensive dashboard nobody uses:
- Decouple your taxonomy from your accounting structure. General ledger codes and cost centers reflect internal budgeting, not the external supply market — build the taxonomy around what you buy, and keep internal organizational attributes as metadata layered on top.
- Move from a periodic engagement to a continuous platform. A one-time analysis is a snapshot that starts decaying the moment it’s delivered. The value compounds when spend intelligence updates continuously and catches leakage as it happens, not a year later.
- Connect analytics to execution, not just reporting. A dashboard that nobody acts on has limited value regardless of how accurate it is. The real return comes when spend intelligence integrates directly with intake orchestration, contract compliance tracking, and risk management — so an identified opportunity turns into a captured saving, rather than an interesting chart in a quarterly review.
If you’re evaluating whether your organization needs a dedicated spend analytics engagement or whether it’s part of a broader transformation, our guide to end-to-end procurement consulting covers how spend analytics fits into the wider Source-to-Pay picture, and the APSentra Partner Network can connect you with certified partners experienced in spend analytics and category-level sourcing.
Illustrative ROI Walkthrough
An interactive calculator is available on the web version of this page; the worked example below shows the same logic using a representative $500M annual spend base.
| Input / Output | Illustrative Value | Basis |
|---|---|---|
| Total addressable spend | $500,000,000 | Example organization |
| Incremental savings from visibility (low → high) | ~1.1 pts (3.7% → 4.8%) | The Hackett Group, 2025 |
| Estimated incremental savings | ~$5,500,000/yr | 1.1% × $500M |
| Leakage reduction from continuous compliance monitoring | Up to ~60% less savings lost | The Hackett Group, 2025 |
| Typical time to a live, actionable system | 6–8 weeks | Vendor/consultancy deployment benchmarks cited above |
These figures are directional, built from the third-party benchmarks cited above, and will vary by industry, data quality, and starting maturity. Request a tailored estimate using your own spend base via a Spend Visibility Assessment.
10 Questions to Ask a Spend Analytics Vendor
Whether you’re evaluating a SaaS platform or a consultancy-led engagement, these ten questions surface the differences that matter most:
- What’s your first-pass classification accuracy, and how exactly is it measured (coverage vs. correctness)?
- How do you handle tail spend and unstructured data — corporate card feeds, dense invoices, expense reports?
- What does the human-in-the-loop review workflow look like, and who on our team owns making corrections?
- Can the taxonomy be fully customized for our direct spend and bill-of-materials structure, not just mapped to a generic framework?
- How do you normalize vendor identities across entities, aliases, and regional subsidiaries?
- What’s the realistic time to a live, actionable system for an organization our size and complexity?
- How is data security, access control, and role-based visibility handled across business units?
- Can the platform or engagement integrate with our existing ERP, P2P, and contract management systems?
- What’s included in the base price versus billed separately — taxonomy design, ongoing tuning, additional data sources?
- Can you provide reference clients with a comparable spend profile, industry, and geographic footprint?
Sources
- The Hackett Group — “Digital World Class® Procurement Teams Achieve 2.6X Higher ROI” (news release, July 14, 2025)
- McKinsey & Company — “Aim Higher and Move Faster for Successful Procurement-Led Transformation” by David Pralong, Jennifer Spaulding Schmidt, Teresa George, and Cole Wirpel (June 9, 2025)
- Sievo — “Pentair: Spend Analysis Case Study” (vendor-published customer case study)
- UNSPSC (United Nations Standard Products and Services Code) and eClass — standard spend/procurement classification frameworks.