Procurement Audit Guide for CFOs: How to Turn Savings into Real ROI
The Savings Mirage: When Procurement’s Numbers Don’t Match Finance’s Reality
Every CFO has been there. The CPO presents a slide: $12 million in negotiated savings. Finance sees $4 million — if that — on the P&L. The gap is not a rounding error. It is a systemic failure in how organizations track, verify, and realize savings.
The numbers are damning. According to research by Ardent Partners and Suplari, most procurement teams lose 30-60% of negotiated savings between contract signature and invoice payment — eroded by contract leakage, volume shifts, and baseline disputes. Organizations that stop tracking at the negotiation stage recover as little as 40 cents of every claimed dollar.
This is the notional savings trap. Savings exist on paper, in procurement dashboards, and in CPO presentations — but never surface on the income statement. For a CFO responsible for board-level reporting, notional savings are worthless. Only realized savings — verified through a rigorous procurement audit and confirmed at the invoice level — constitute genuine P&L impact.
“Procurement ROI will not materialize through ambition alone. Until the foundations of savings verification are strengthened, organizations will continue to face a persistent gap between investment and outcome.”
— RGP CFO AI & Technology ROI Survey
The answer isn’t to distrust procurement. It’s to build the governance infrastructure — centered on a continuous procurement audit — that makes savings verification automatic, auditable, and finance-grade.
Key Takeaways
30–60% of negotiated savings never reach the P&L. Only 22% of companies measure savings after spend occurs. Notional savings ≠ realized savings — only invoice-validated reductions count
What Is a Procurement Audit — and Why CFOs Must Own It?
A procurement audit is a systematic, evidence-based review of an organization’s purchasing activities, supplier contracts, and payment records. Its purpose isn’t compliance alone — it’s savings verification: confirming that the value identified during sourcing has translated into measurable, finance-approved reductions in actual spend.
A well-run procurement audit answers three questions every CFO needs answered:
- Did our negotiated prices actually appear on supplier invoices?
- Did teams buy from contracted suppliers at agreed volumes?
- Are the savings we claimed last quarter visible in this quarter’s P&L?
Historically, procurement audits were reactive — triggered by compliance concerns or budget overruns. The modern CFO treats the procurement audit as a proactive, continuous process embedded in the financial operating rhythm. Quarterly audits, aligned to the budget cycle, are the standard for finance leaders who need to defend investment decisions to boards and investors.
Why Procurement and Finance Speak Different Savings Languages
The root problem is definitional. Procurement and finance measure savings at different points in the lifecycle — and that gap is exactly where value disappears.
| Savings Stage | Who Claims It | In the P&L? | CFO Confidence |
|---|---|---|---|
| Negotiated | Procurement | No | Low |
| Contracted | Procurement | Rarely | Low–Medium |
| Implemented | Operations | Partially | Medium |
| Realized (Invoiced) | Finance | Yes | High |
| Validated | Finance + Procurement | Confirmed | Highest |
Procurement counts savings at contract signature. Finance counts them when invoices clear. The procurement audit reconciles these two realities — turning procurement intent into finance-validated P&L impact.
Why Most Savings Tracking Fails (and what to do instead)
Most organizations believe they have a savings tracking process. They don’t. They have a savings reporting process — and there’s a critical difference.
Savings reporting records what procurement negotiated. Savings tracking verifies what finance actually received. The conflation of the two is the single biggest cause of the procurement–finance credibility gap.
The Three Myths That Keep CFOs in the Dark
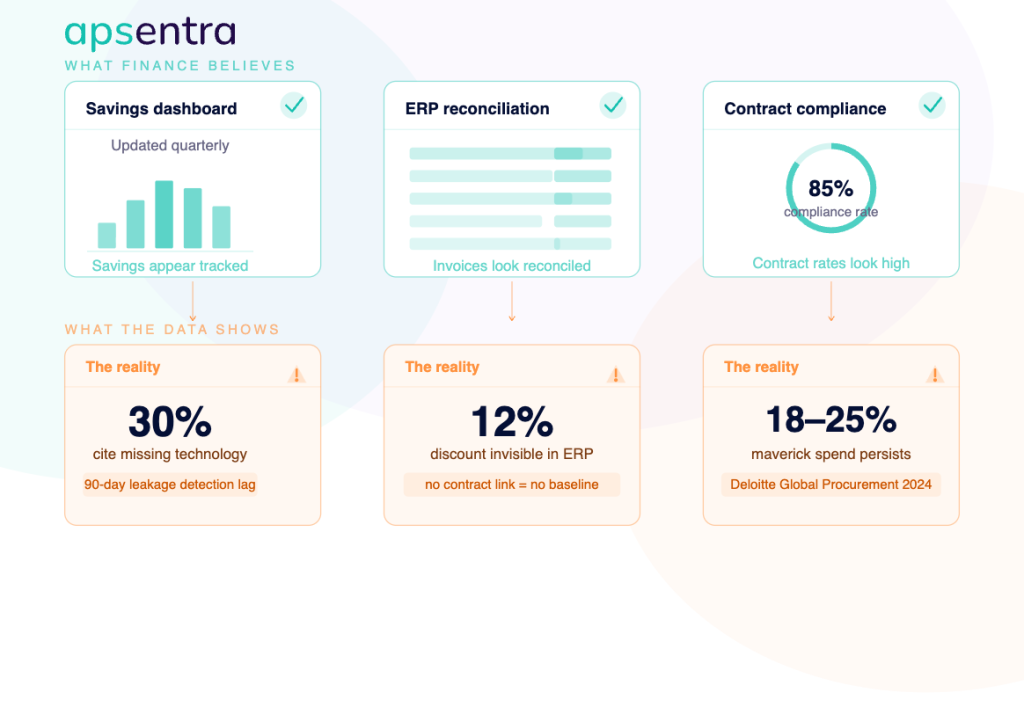
Myth 1: “Our procurement team tracks savings in a dashboard.”
Reality: According to Ardent Partners CPO Rising 2025, 30% of procurement professionals cite missing or incomplete technology as a major challenge. The majority track savings in spreadsheets updated quarterly — meaning leakage is identified, at best, 90 days after it began.
Myth 2: “Finance can reconcile procurement savings from the ERP.”
Reality: ERP systems record what was paid, not what was saved. Without a connected contract management system and an agreed baseline, the ERP cannot attribute invoice spend to a specific negotiation outcome. Finance sees the invoice; it cannot see the 12% it was supposed to be discounted.
Myth 3: “Our contract compliance rate is high.”
Reality: Deloitte’s 2024 Global Procurement Survey found that maverick spend averages 18–25% of total addressable spend even in organizations with formal contract management. High contract compliance rates often reflect what was measured, not what actually happened.
Key Takeaways
Reporting savings and tracking savings are not the same thingERP data alone cannot validate procurement ROI without a contract baseline layer
The Four Stages Where Value Leaks — and How a Procurement Audit Catches Them
Most savings don’t disappear in one dramatic event. They leak, quietly, across four failure modes. A thorough procurement audit maps and recovers each one.
1. Maverick Buying — Contracts Signed, Ignored in Practice
A 15% discount is agreed with Supplier A. Three months later, teams are still ordering from Supplier B — out of habit, convenience, or missing system enforcement. The procurement audit tracks actual purchasing behavior against contract terms, surfacing rogue spend before it compounds across quarters.
2. Volume Shifts That Erode Unit-Price Wins
Many savings projections assume stable purchase volumes. When demand drops, so does the realized saving — even if the unit price holds. Savings verification normalizes for volume change, cleanly separating genuine price improvement from demand-driven P&L variance.
3. Specification Creep After Contract Execution
Upgraded specs, added service levels, changed delivery terms — scope changes after signing silently erode the original saving. A procurement audit surfaces mid-contract amendments before they contaminate the annual savings report.
4. Baseline Disputes — The Most Preventable Leak of All
If no one agreed on the pre-negotiation cost benchmark before sourcing began, every savings claim is contestable. The most common source of P&L impact disagreement isn’t execution failure — it’s the absence of a finance-approved baseline. Lock it before negotiations start.
Common savings leakage sources — and how APSentra resolves them:
| Leakage Source | Root Cause | APSentra Procurement Audit Fix |
|---|---|---|
| Maverick buying | Teams bypass agreed contracts | Real-time contract compliance alerts |
| Volume shifts | Demand drops post-negotiation | Baseline normalization engine |
| Specification creep | Scope changes mid-contract | Contract-to-invoice line matching |
| Baseline disputes | No finance-approved benchmark | Pre-negotiation baseline locking |
| Supplier non-compliance | Wrong pricing applied at invoice | Automated invoice validation |
Savings Verification: Translating Procurement Wins Into P&L Impact
Savings verification is the operational core of the procurement audit. It confirms, at the invoice level, that negotiated terms were honored — and that the cost reduction is visible in the financial statements. Without it, organizations run on financial faith, not financial fact.
The most reliable savings verification methodology combines three elements:
- Finance-approved savings methodology — agreed before negotiations begin. Defines what qualifies as a saving, how the baseline is set, and how volume adjustments are handled. Without pre-agreement, every savings discussion after the fact becomes a renegotiation.
- Invoice-level validation — actual invoices matched against contract terms across a 12-month post-execution window. Confirms the negotiated price reached the transaction, the right supplier was used, and committed volumes held.
- Closed-loop tracking — an auditable evidence chain from opportunity identification through to P&L confirmation. This is what survives a CFO’s scrutiny in a board review, external audit, or post-merger integration.
The Savings Pipeline: Four Valves, One Bottom Line
Realized ROI is a pipeline with four governance checkpoints — each one a valve in the procurement audit process:
- Identified — Savings opportunity surfaced through spend analysis or market benchmarking
- Contracted — Terms agreed and signed; procurement records the saving
- Realized — Invoices confirm the contracted price was honored at actual volume
- Validated — Finance sign-off confirms the saving appears in the P&L; the loop is closed
Organizations that track through all four stages recover 75–85% of their identified savings potential. Those that stop at Stage 2 (Contracted) typically realize fewer than 40%. The procurement audit is the difference between those two numbers.
Only 22% of companies measure savings after spend has actually occurred (Suplari Savings Research, 2025). The vast majority report procurement ROI on projections, not evidence — a position that is increasingly untenable for CFOs under board-level scrutiny.
Estimate Your Unrealized Savings – use this quick formula to estimate what your organization may be leaving on the table:
Annual contracted savings × (1 − your realization rate) = unrealized savings
Example: $8M contracted savings × (1 − 0.58 realization) = $3.36M unrealized per year
Use APSentra’s savings calculator to model your specific categories and spend.
Case Study: Recovering 22% Leakage in a $10M Category
| Industry: Manufacturing Category: MRO (Maintenance, Repair & Operations) Annual Spend: $10.2M |
A global manufacturer had recently renegotiated its MRO contracts across 14 supplier relationships, projecting $1.8M in annual savings — a 17.6% reduction on a $10.2M spend category. Twelve months later, finance reported actual savings of $1.4M. The CFO wanted to understand where $400,000 had gone.
Step 1 — Baseline verification: the audit team compared the pre-negotiation baseline (documented at contract signature) against the agreed finance baseline.
Result: two of 14 contracts used list price as the baseline rather than the actual prior-year invoiced rate overstating projected savings by $180,000.
Step 2 — Contract adoption audit: the team ran invoice-level spend analysis across all 14 suppliers.
Result: three sites were still purchasing from non-contracted alternatives for 23% of their MRO volume. Leakage from contract non-adoption: $134,000.
Step 3 — Invoice price matching: contracted rates were compared to actual invoiced rates for every line item.
Result: one supplier was invoicing at the pre-negotiation rate for specialty components, undetected for 6 months. Overcharge recovered: $61,000.
Step 4 — Volume normalization: actual purchase volumes were compared against the volumes used to model the savings projection.
Result: volume was down 8% across the category due to a production slowdown. Volume-adjusted savings target was recalculated, removing $85,000 from the expected saving (legitimate variance, not leakage).
The Outcome
Total leakage identified and recoverable: $375,000 (22% of the projected saving). Of this, $295,000 was recoverable through supplier negotiation, process correction, and overcharge credit. The remaining $80,000 represented unavoidable variance due to demand change.
The procurement audit, completed in 6 weeks using APSentra’s automated invoice matching, paid for itself in the first month of leakage recovery. The CFO’s office now runs quarterly audits on all categories above $2M annually — and savings realization has risen from 78% to 91% across the portfolio.
The APSentra Audit Index: A Proprietary Framework for CFOs
Most procurement audit approaches treat savings verification as a binary question: did we save money or not? The APSentra Audit Index (AAI) takes a multi-dimensional approach — scoring six dimensions of procurement audit maturity to give CFOs a single, board-presentable score for savings realization health.
The AAI scores your organization across six dimensions on a 0–100 scale. An AAI score below 50 indicates significant leakage risk. Above 80 indicates best-in-class savings governance.
| Dimension | What It Measures | APSentra Score Input |
|---|---|---|
| Baseline Integrity | Is the pre-negotiation benchmark finance-approved? | Baseline lock date vs. RFP date |
| Contract Adoption | % of eligible spend routed to contracted suppliers | PO compliance rate by category |
| Invoice Accuracy | Do invoiced prices match contracted rates? | Invoice-to-contract match rate |
| Volume Realization | Did actual volumes match committed volumes? | Volume variance by contract |
| Leakage Rate | % of negotiated savings lost post-contract | Realized vs. identified savings ratio |
| Validation Lag | Days between spend and finance sign-off | Audit cycle time |
What Your AAI Score Means
AAI <40: Critical. Savings realization below 45%. Procurement savings claims lack finance credibility.
AAI 80–100: Best-in-class. Savings realization rate typically >82%. Audit findings are exceptions, not norms.
AAI 60–79: Competent. Savings realization 65–80%. Moderate leakage from contract adoption gaps.
AAI 40–59: At-risk. Savings realization 45–65%. Systemic issues in baseline and invoice validation.
Building a Procurement Audit Framework Finance Can Trust
A procurement audit framework isn’t a one-time project. It’s standing governance infrastructure that embeds savings verification into the normal operating rhythm of the finance function.
Step 1: Establish a Shared Savings Language
Finance and procurement must agree on a common taxonomy before any sourcing event. Define hard savings (direct, measurable cost reductions in the P&L) versus soft savings (cost avoidance, efficiency gains, improved payment terms). Document it. Make it mandatory for all initiatives above a materiality threshold.
Step 2: Lock the Baseline Before Negotiations Start
Every savings claim is relative to a benchmark. Without a finance-approved pre-negotiation baseline, locked before the sourcing event — every future claim is disputable. Account for historical invoiced rates (not list price), seasonal volume patterns, and known demand changes.
Step 3: Run Invoice-Level Procurement Audits Quarterly
Monthly invoice matching surfaces leakage early, when correction is still possible. Quarterly procurement audit reviews — conducted jointly by finance and procurement — reconcile claimed savings against actual P&L movement. Variances are investigated and resolved within the same budget period.
Step 4: Integrate Procurement Audit Data Into the CFO Dashboard
Realized savings data belongs alongside EBITDA, working capital, and operating costs in the CFO’s view. When P&L impact from procurement initiatives is visible in real time — not 90 days after the quarter closes — finance can use procurement as a strategic lever.
Step 5: Post-Mortem Every Major Initiative
For any sourcing initiative above the materiality threshold, a structured post-mortem at 6 and 12 months post-execution compares projected savings to realized outcomes. These reviews are the institutional memory that sharpens future audit methodology.
Key Takeaways
Lock the baseline using actual invoiced rates — not list price or benchmark quotes. Quarterly joint reviews by finance and procurement close 80%+ of leakage within the same period. Real-time P&L visibility transforms procurement from a cost center into a strategic lever.
Industry Benchmarks: Where Does Your Organization Stand?
The following benchmarks are drawn from publicly cited research and APSentra platform data across 200+ enterprise customers. Use them to calibrate your procurement audit maturity.
| Metric | Industry Median | Top Quartile | Source |
|---|---|---|---|
| Savings realization rate | 55–65% | 75–85% | Ardent Partners CPO Rising 2025 |
| Maverick spend rate | 18–25% | <8% | Deloitte Procurement Survey 2024 |
| Post-contract audit coverage | 22% | >80% | Suplari Savings Research 2025 |
| Invoice-to-contract match rate | 61% | >92% | Zycus Savings Realization Report |
| Audit cycle time (days) | 90+ days | <30 days | APSentra Platform Data 2025 |
How APSentra Closes the Savings Loop
Stop Chasing Savings. Start Proving Them.
APSentra is the end-to-end procurement platform built for finance leaders who are done with the procurement–finance credibility gap. We connect negotiation outcomes directly to invoice-level spend data — automatically — giving CFOs and CPOs one auditable source of truth for savings verification and P&L impact.
What APSentra delivers for CFOs:
- Full procurement audit trails — from opportunity identification through to validated P&L impact
- Real-time savings verification dashboard aligned to your finance reporting cycle
- Finance-grade baseline locking and volume normalization — defensible before sourcing begins
- Leakage detection alerts that surface maverick buying and contract non-compliance before quarter-end
- CFO-ready reporting that reconciles procurement savings with actual P&L movement — quarter by quarter
From procurement plan to contract — fully managed, fully visible.
Procurement Audit Checklist for CFOs
Use this framework before, during, and after every major sourcing initiative to ensure savings verification is rigorous and P&L impact is fully defensible.
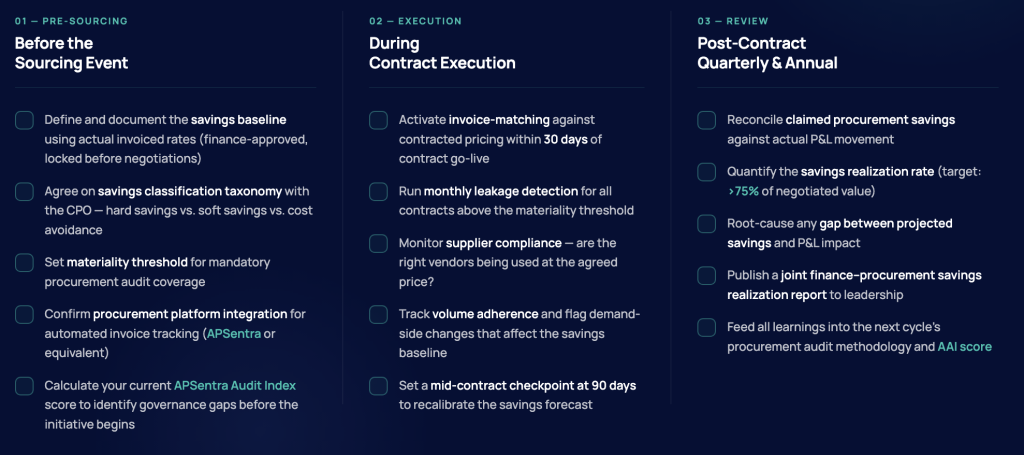
Before the Sourcing Event
- Define and document the savings baseline using actual invoiced rates (finance-approved, locked before negotiations)
- Agree on savings classification taxonomy with the CPO — hard savings vs. soft savings vs. cost avoidance
- Set materiality threshold for mandatory procurement audit coverage
- Confirm procurement platform integration for automated invoice tracking (APSentra or equivalent)
- Calculate your current APSentra Audit Index score to identify governance gaps before the initiative begins
During Contract Execution
- Activate invoice-matching against contracted pricing within 30 days of contract go-live
- Run monthly leakage detection for all contracts above the materiality threshold
- Monitor supplier compliance — are the right vendors being used at the agreed price?
- Track volume adherence and flag demand-side changes that affect the savings baseline
- Set a mid-contract checkpoint at 90 days to recalibrate the savings forecast
Post-Contract — Quarterly and Annual Reviews
- Reconcile claimed procurement savings against actual P&L movement
- Quantify the savings realization rate (target: >75% of negotiated value)
- Root-cause any gap between projected savings and P&L impact
- Publish a joint finance–procurement savings realization report to leadership
- Feed all learnings into the next cycle’s procurement audit methodology and AAI score
The CFO’s Imperative: Close the Savings Loop
The notional savings trap isn’t a procurement problem. It’s a governance problem — and it sits squarely in the CFO’s jurisdiction. When finance and procurement operate on different definitions, different systems, and different timelines, value leaks at every stage of the lifecycle.
A procurement audit — rigorous, continuous, and finance-owned — closes the loop. It transforms claimed savings into verified savings, projected P&L impact into confirmed P&L impact, and procurement from a cost center into a measurable value generator.
The CFOs who define the next decade of enterprise performance won’t be the ones who approved the largest procurement budgets. They’ll be the ones who built the governance infrastructure to prove — quarter by quarter, invoice by invoice — that every claimed saving actually reached the bottom line.The savings are real. Now prove it.
Methodology Note
This article references several data points sourced from third-party research and APSentra’s own platform analysis.
Third-Party Data Sources
- 30–60% savings leakage figure: Sourced from Suplari Savings Research (2025) and corroborated by Ardent Partners CPO Rising 2025. Reflects the range across industry segments; manufacturing and indirect spend categories typically fall at the higher end of this range.
- 22% post-spend measurement: Sourced from Suplari procurement savings research (2025), representing the percentage of organizations that conduct savings verification after spend has occurred.
- 75–85% realization rate (four-stage tracking): Derived from Suplari platform outcome data and cross-referenced with Zycus Savings Realization Report benchmarks.
- 14% CFO AI ROI figure: Sourced from RGP CFO AI & Technology ROI Survey, December 2025. n=200 U.S. CFOs across $500M–$10B+ revenue companies.
- Maverick spend 18–25%: Deloitte Global Procurement Survey 2024.
APSentra Platform Data
References to APSentra platform benchmarks (e.g., audit cycle time, realization improvements in the case study) are drawn from aggregated, anonymized customer data across APSentra’s enterprise customer base (200+ organizations). Individual results vary based on spend complexity, category mix, and implementation depth. The case study organization has provided consent for anonymized use of outcomes data.
FAQs:
What is the difference between a procurement audit and a financial audit?
A financial audit verifies the accuracy of financial statements. A procurement audit specifically examines purchasing activities, contract compliance, and savings realization — confirming that negotiated value has translated into actual P&L impact. The procurement audit is operationally focused; the financial audit is attestation-focused. Both are necessary, and leading organizations use procurement audit findings to directly strengthen the financial audit process.
How often should a CFO run a procurement audit?
Best practice is quarterly procurement audits for high-spend categories and strategic supplier contracts, with an annual full-scope review covering all contracted spend above the materiality threshold. Organizations running quarterly audits consistently report higher savings realization rates than those auditing annually or on an ad-hoc basis.
What is savings verification — and why does the CFO need to own it?
Savings verification is the process of confirming, using actual invoice data, that negotiated savings have reached the P&L. The CFO must co-own savings verification because procurement’s definition of savings and finance’s definition frequently diverge. When finance owns the verification methodology, the savings claim is credible, auditable, and defensible to the board and to external auditors.
What percentage of negotiated savings typically fails to reach the P&L?
Industry benchmarks indicate that organizations tracking savings only at the negotiation stage realize as little as 40–70% of their claimed value (Suplari, Zycus). The primary culprits are maverick buying, volume changes that erode unit-price savings, and the absence of a finance-approved baseline. A structured procurement audit process consistently raises savings realization above 75%.
Can a procurement audit improve technology investment ROI too?
Yes. The same savings verification methodology applies to technology investments. Only 14% of CFOs report clear, measurable P&L impact from AI spending (RGP, December 2025). The root cause is identical: benefits are projected at approval but never tracked through to realization. Applying procurement audit principles — baseline, track, validate — to technology initiatives closes this gap across your entire investment portfolio.
How does a procurement audit handle cost avoidance claims?
Cost avoidance — preventing a future price increase rather than reducing current spend — is hard to defend to finance because the spend that ‘didn’t happen’ doesn’t appear in the P&L. A procurement audit creates the documentation trail: the proposed price, the negotiated outcome, and evidence that the lower price appeared on subsequent invoices. It makes cost avoidance auditable, not theoretical.
What technology does an effective procurement audit require?
At minimum, a system that connects contract data to invoice-level transaction data automatically — eliminating the quarterly spreadsheet reconciliation that most organizations still rely on. APSentra extends this with leakage detection alerts, volume normalization, finance-aligned savings dashboards, and a closed audit trail from opportunity identification to validated P&L impact.