Manufacturing Supply Chain in 2026: Where the Pressure Is and What Actually Works
This guide covers what manufacturing supply chain management actually spans, where the pressure is coming from this year according to current survey data, why most of the risk sits in suppliers a manufacturer cannot see, and which fixes work on which timeline.
What Manufacturing Supply Chain Management Covers
Manufacturing supply chain management is the planning, sourcing, and control of everything a manufacturer needs to produce and deliver goods: raw materials, components, industrial equipment, energy, logistics, and maintenance supplies. It spans every supplier tier, from contracted Tier 1 vendors to the sub-suppliers and material sources behind them.
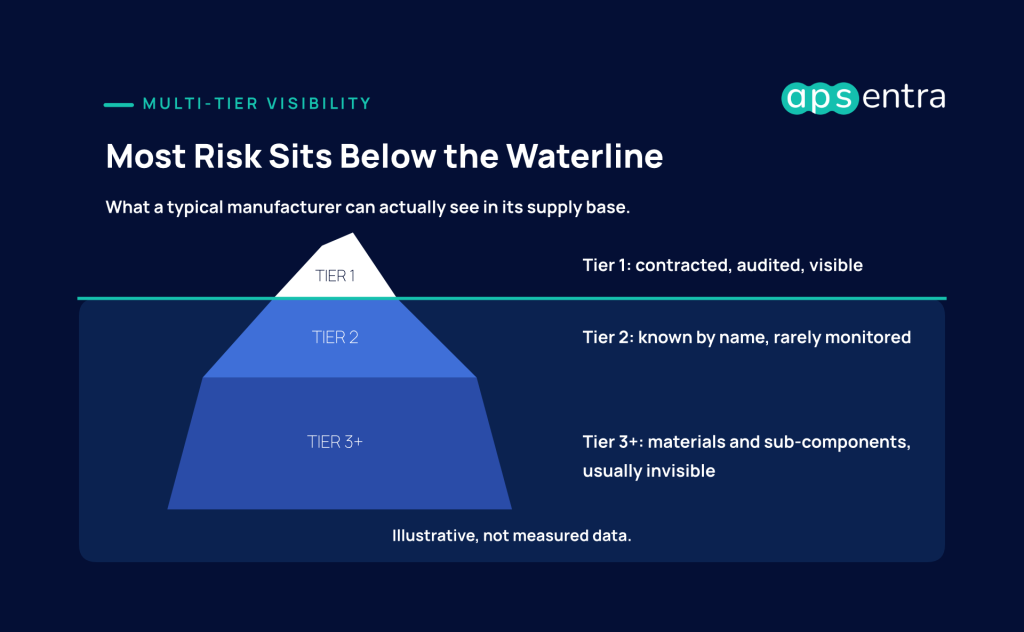
That last clause is where most of the difficulty lives. A manufacturer’s contracts, scorecards, and audits usually stop at Tier 1. The disruptions that actually stop a line frequently start two or three levels further down, with a sub-component maker, a resin producer, or a single casting foundry that nobody in procurement has ever spoken to.
The scope also runs wider than direct materials. Energy, freight, industrial machinery, and the steady flow of maintenance, repair, and operations (MRO) supplies all sit inside the same supply chain and increasingly move the same cost line.
For discrete manufacturers, the direct-materials side of this, including bill-of-materials cost structures and should-cost modeling, is covered in depth in our guide to OEM procurement consulting.
Where the Pressure Is Coming From in 2026
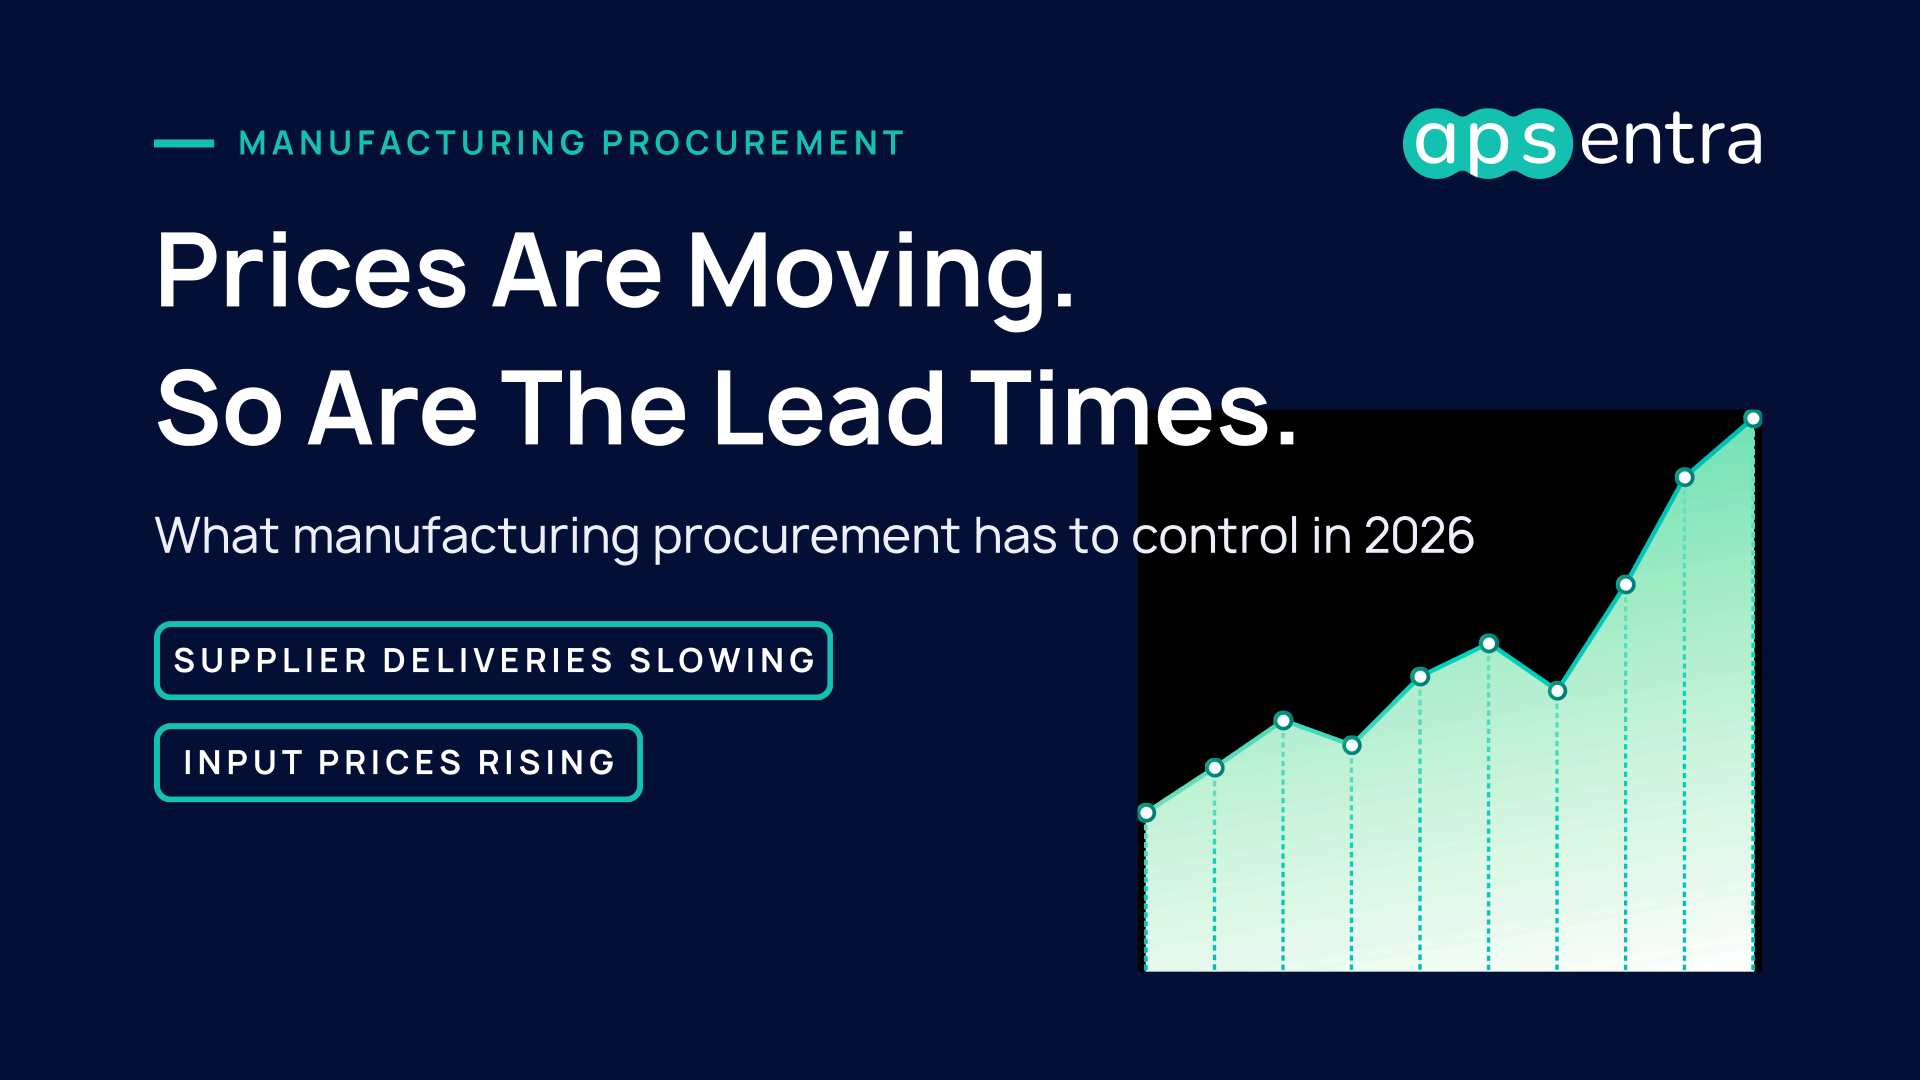
In 2026, the main pressure on manufacturing supply chains is cost rather than availability. Rising raw material costs became the top challenge for U.S. manufacturers in the second quarter, ahead of trade uncertainty, transportation and logistics costs, and supply disruptions themselves.
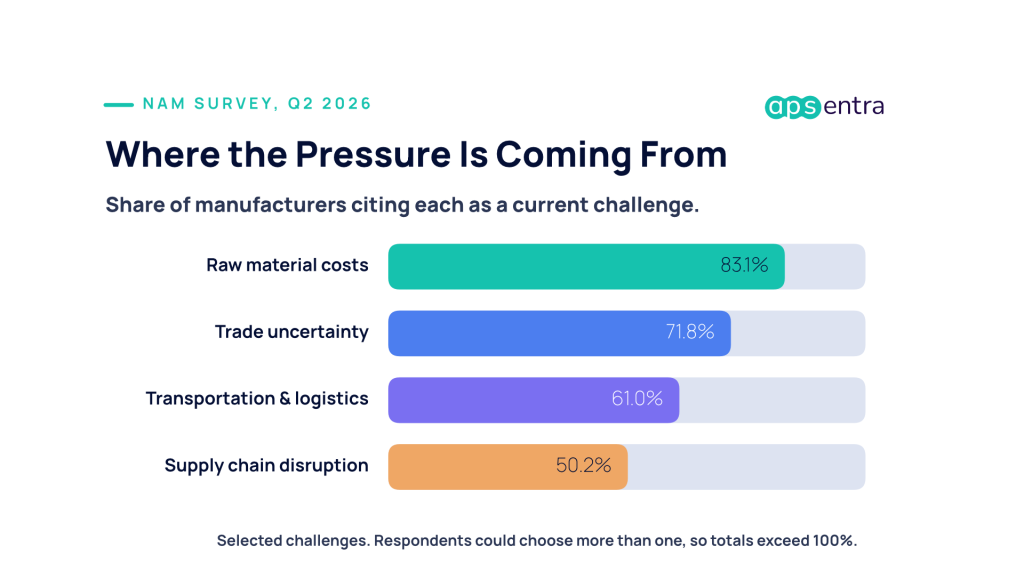
The National Association of Manufacturers’ Q2 2026 Manufacturers’ Outlook Survey found that 83.1 percent of respondents named increased raw material costs as a top business challenge, a jump of 25.6 percentage points from 57.5 percent in the first quarter. Trade uncertainty followed at 71.8 percent and ranked first among companies with more than 500 employees.
The cause of the jump was largely external. In the same survey, 72.0 percent of manufacturers said the conflict in the Middle East had raised the cost of their energy inputs, and 43.1 percent reported higher costs for non-energy inputs as supply tightened.
What makes this significant for supply chain teams is the shift in what “risk” means. A shortage is visible and gets escalated. A steady rise in input cost is quieter, arrives through dozens of invoices, and erodes margin without ever triggering an incident. Supply chain management built only to prevent stockouts will miss it.
Input Costs: The Number Moving Fastest
Manufacturers’ own expectations for input prices moved sharply in a single quarter and have not fully retreated.
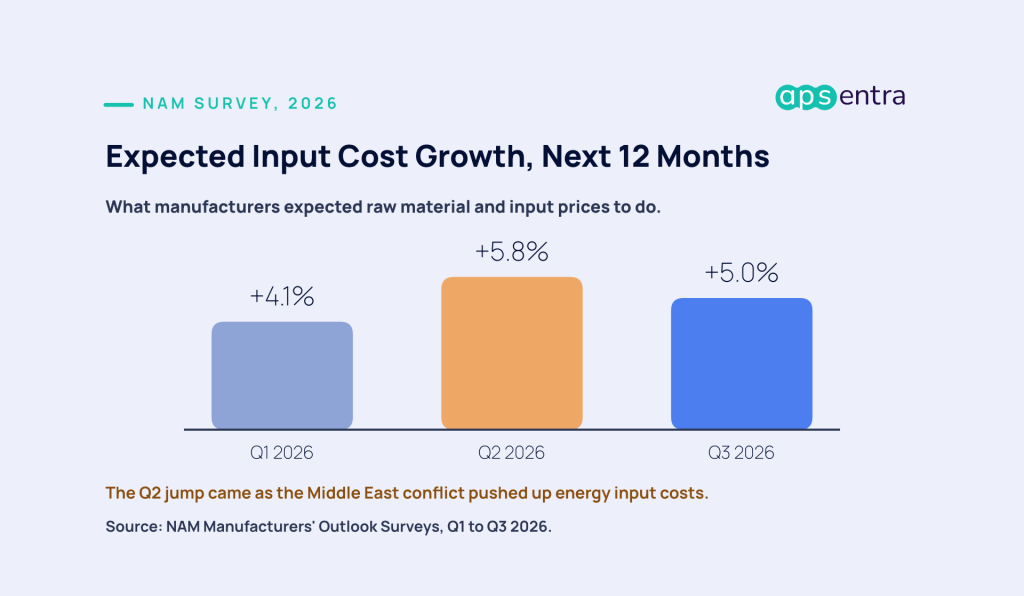
Expected growth in raw material and input costs over the following twelve months rose from 4.1 percent in the first quarter to 5.8 percent in the second. By the Q3 2026 survey, it had eased to 5.0 percent, still well above where the year started, and raw material costs remained the top business challenge for a second consecutive quarter.
Logistics is compounding the problem. In the third quarter, 77.3 percent of manufacturers cited freight rates as a challenge and 74.1 percent cited fuel costs, while 98.6 percent said they rely on trucks to move goods. For most plants, there is no alternative mode that absorbs a fuel shock.
Three practical responses follow from this, none of which require predicting where prices go next.

Index the contracts that should be indexed

Separate freight from product cost

Track expected cost against realized cost
The gap between negotiated and realized cost is the central problem in procurement cost reduction strategies, and it matters more when input prices are rising than when they are flat.
The Visibility Problem Below Tier 1
Most manufacturers know their direct suppliers well. Far fewer know who supplies those suppliers.
The volatility is real and rising. NAM’s Q1 2026 survey found that 63.3 percent of manufacturers saw supply chain risk and volatility increase over the previous twelve months, with 25.3 percent describing the increase as significant. Only 7.9 percent reported that volatility had decreased.
Geographic concentration is part of the exposure. In the same survey, 54.6 percent of manufacturers said they rely on Canada or Mexico for critical parts of their supply chain, and among those, 82.2 percent source raw materials or other inputs from either country. That dependence is sensible commercially and still represents concentration that a single trade or border event can test.
The visibility gap below Tier 1 has three common consequences.
- Hidden single sourcing. Two apparently independent Tier 1 suppliers may buy the same critical sub-component from the same Tier 2 source. On paper the category is dual-sourced. In practice it is not.
- Late warning. When a Tier 3 disruption occurs, the manufacturer typically hears about it from its Tier 1 supplier, weeks after the event, once the buffer upstream has already been consumed.
- Misallocated effort. Supplier audits concentrate on Tier 1 because that is where the contracts are, even when the real exposure sits a level or two further down.
Mapping below Tier 1 is increasingly a platform capability rather than a one-time consulting exercise, which is examined in our review of vendor management software. For macro context, the Federal Reserve Bank of New York publishes a free monthly Global Supply Chain Pressure Index that combines transportation costs and manufacturing survey data across seven major economies, which is a useful external signal to track alongside your own supplier data.
Resilience Levers and How Long They Take
Every resilience lever works. The question that decides which one to pull is how long each takes to reduce exposure, because a fix that arrives after the disruption is a fix for the next one.
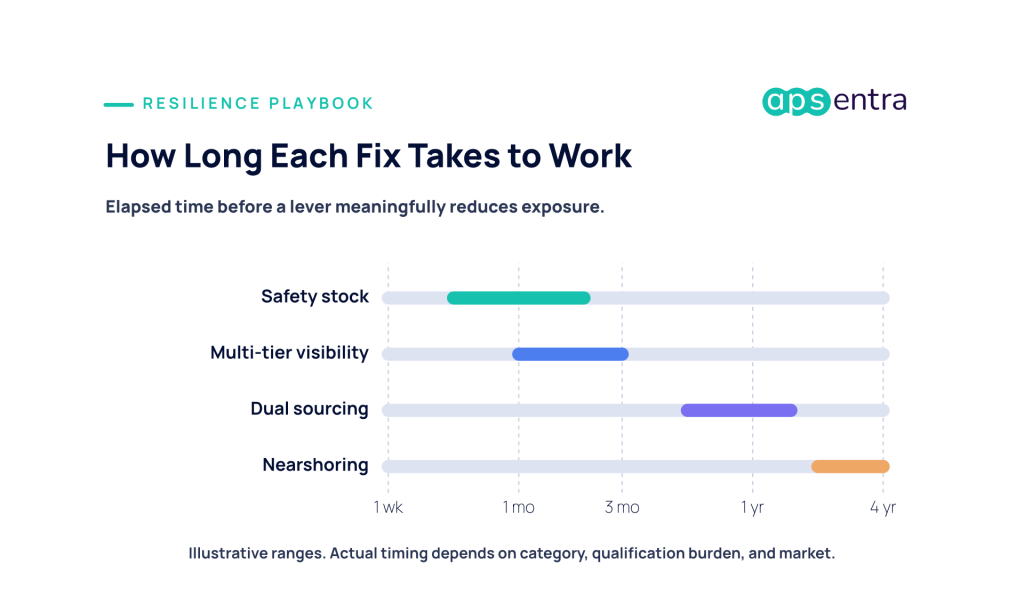
| Lever | What it protects against | Main cost |
|---|---|---|
| Safety stock | Short disruptions and demand spikes | Working capital and storage; obsolescence risk |
| Multi-tier visibility | Hidden single sourcing and late warning | Data effort and supplier cooperation |
| Dual sourcing | Loss of a single supplier | Qualification time, split volume, weaker leverage |
| Nearshoring | Long-distance logistics and trade exposure | Capital, higher unit cost, multi-year transition |
The sequencing that usually works is fastest-first. Buffer the categories that cannot wait, map the supply base to find which of them are genuinely single-sourced, qualify alternates for those, and reserve nearshoring for categories where the exposure is structural and permanent.
Nearshoring is already visible in the data, even if it takes years to complete. In the Q3 survey, 63.0 percent of manufacturers said they plan to import industrial machinery in the coming year, and 63.6 percent of those intend to use it for new or expanded operations. Qualifying a second source is the faster lever, and the discipline behind it is covered in strategic sourcing consulting.
Direct Materials, MRO, and the Spend Nobody Watches
Direct materials get the attention because they sit on the bill of materials. MRO spend is smaller, fragmented across thousands of low-value orders, and often more disruptive than its size suggests.
A missing bearing, seal, or drive belt can idle a line as effectively as a missing component, and MRO purchasing is frequently the least governed spend in a plant. Items get reordered from whoever answered the phone last time, specifications drift, and duplicate part numbers accumulate across sites.
In NAM’s Q2 survey, 54.3 percent of manufacturers named industrial machinery, including electrical power distribution equipment, as most critical to their operations over the next year, and 22.1 percent named legacy chips. Both are categories where a long lead time on a replacement part can matter more than the part’s price.
Where analytics can help first in this category is set out in our guide to AI in MRO procurement. The same pattern of long-lead critical spares appears in a regulated setting in power plant supply chain management.
Turning Resilience Into a System
Most manufacturers can produce a resilience plan. The difference between a plan and a resilient supply chain is whether the rules in the plan are applied every time someone places an order.
- One supplier record across plants. If each site holds its own vendor master, concentration risk is invisible by construction, because nobody can see that five plants depend on the same sub-supplier.
- Risk classification that drives behavior. A category flagged as single-sourced should trigger a different approval and stocking rule, not just a note in a spreadsheet.
- Spend visibility at the moment of commitment. Rising input costs need to be visible when a purchase order is raised, not in a quarterly variance report after the money has gone.
- Contracts connected to purchasing. Index clauses, volume tiers, and price-review dates only protect margin if the system applies them to the orders that follow.
The data foundation underneath all four is a clean, classified view of spend by category and supplier, which is covered in spend analytics consulting. For automotive manufacturers, where multi-tier exposure is most acute, the sector-specific version is in auto procurement consulting.