Procurement Cost Reduction Strategies: What Actually Works
This guide covers where cost reduction actually comes from, why so much of the identified number leaks out before it reaches the P&L, and what separates procurement functions that make savings stick from the ones that report the same category savings three years running.
What Procurement Cost Reduction Actually Means
Procurement cost reduction is the practice of lowering the cost of goods and services a company buys through negotiation, demand management, supplier consolidation, and process control, in a way that shows up as a sustained change in the cost baseline rather than a one-time number on a report. The distinction that matters most is between identified savings and realized savings: the first is what a sourcing event or negotiation produced on paper, the second is what actually reduced spend.
Most of the industry’s attention goes to the first half of that sentence. A negotiation lowers a unit price by 12 percent, a spend analysis flags a consolidation opportunity, a category strategy identifies a better-fit supplier. All of that is real work and it produces a real number. Whether that number survives contact with actual purchasing behavior over the following twelve months is a separate question, and it is the one this guide is mostly about.
Cost reduction also splits along a second axis: one-time versus sustained. A single successful negotiation is one-time by nature, a favorable event that will not repeat itself without another negotiation. A demand policy that stops a category from being overbought, or a contract structure that price increases cannot quietly pass through, is sustained. Programs that only ever pull the one-time lever spend every year re-fighting the same battle.
Cost reduction sits inside a wider capability question. A single negotiation can be run by almost anyone with market data. A repeatable reduction program requires the operating structure covered in our guide to the procurement operating model, since decision rights and governance determine whether a negotiated price actually holds.
Where the Savings Concentrate
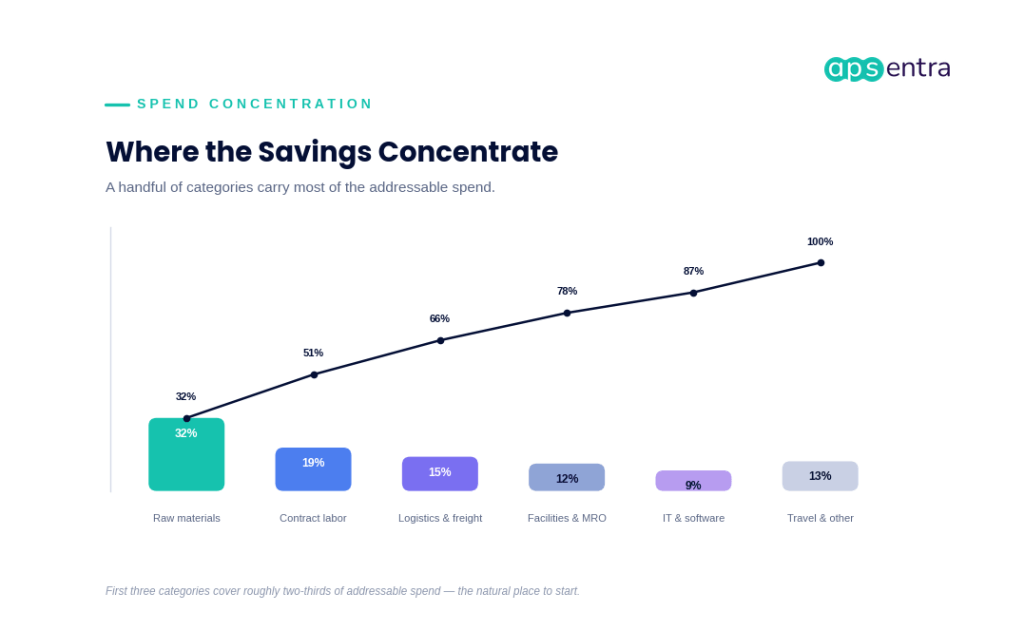
In most spend portfolios, a small number of categories account for the majority of addressable savings, following the same concentration pattern found in general spend analysis. Prioritizing by category size rather than by ease of negotiation is what separates a program with real financial impact from one that produces a long list of small wins.
This concentration is the same 80/20 pattern that CIPS’s Pareto analysis framework describes for prioritizing spend: a minority of categories, classified as “A items” by value, warrant the tightest management attention, while low-value “C items” are better served by lightweight, low-effort controls. Applying that same classification to a savings program, rather than only to inventory, is what turns a category list into a sequencing decision.
The instinct in a young program is to start with whatever category is easiest to negotiate, usually something small and transactional where a supplier will concede quickly to keep the relationship. That produces a fast win and a slide that looks good in a monthly update. It does very little for the P&L.
The categories that carry real savings potential are usually the ones nobody wants to start with: technically complex, politically sensitive because a business stakeholder has a relationship with the incumbent, or simply large enough that a sourcing event takes real time to run. Sequencing a program by ease rather than by size is the single most common reason a cost reduction program produces a busy first year and a disappointing second one.
Building the category-level view that this prioritization depends on is a spend-analysis exercise before it is a negotiation one, covered in our guide to spend analytics consulting. Categories too small to justify a dedicated event still deserve a policy, which is the argument made in tail spend management.
The Three Levers: Price, Demand, and Process
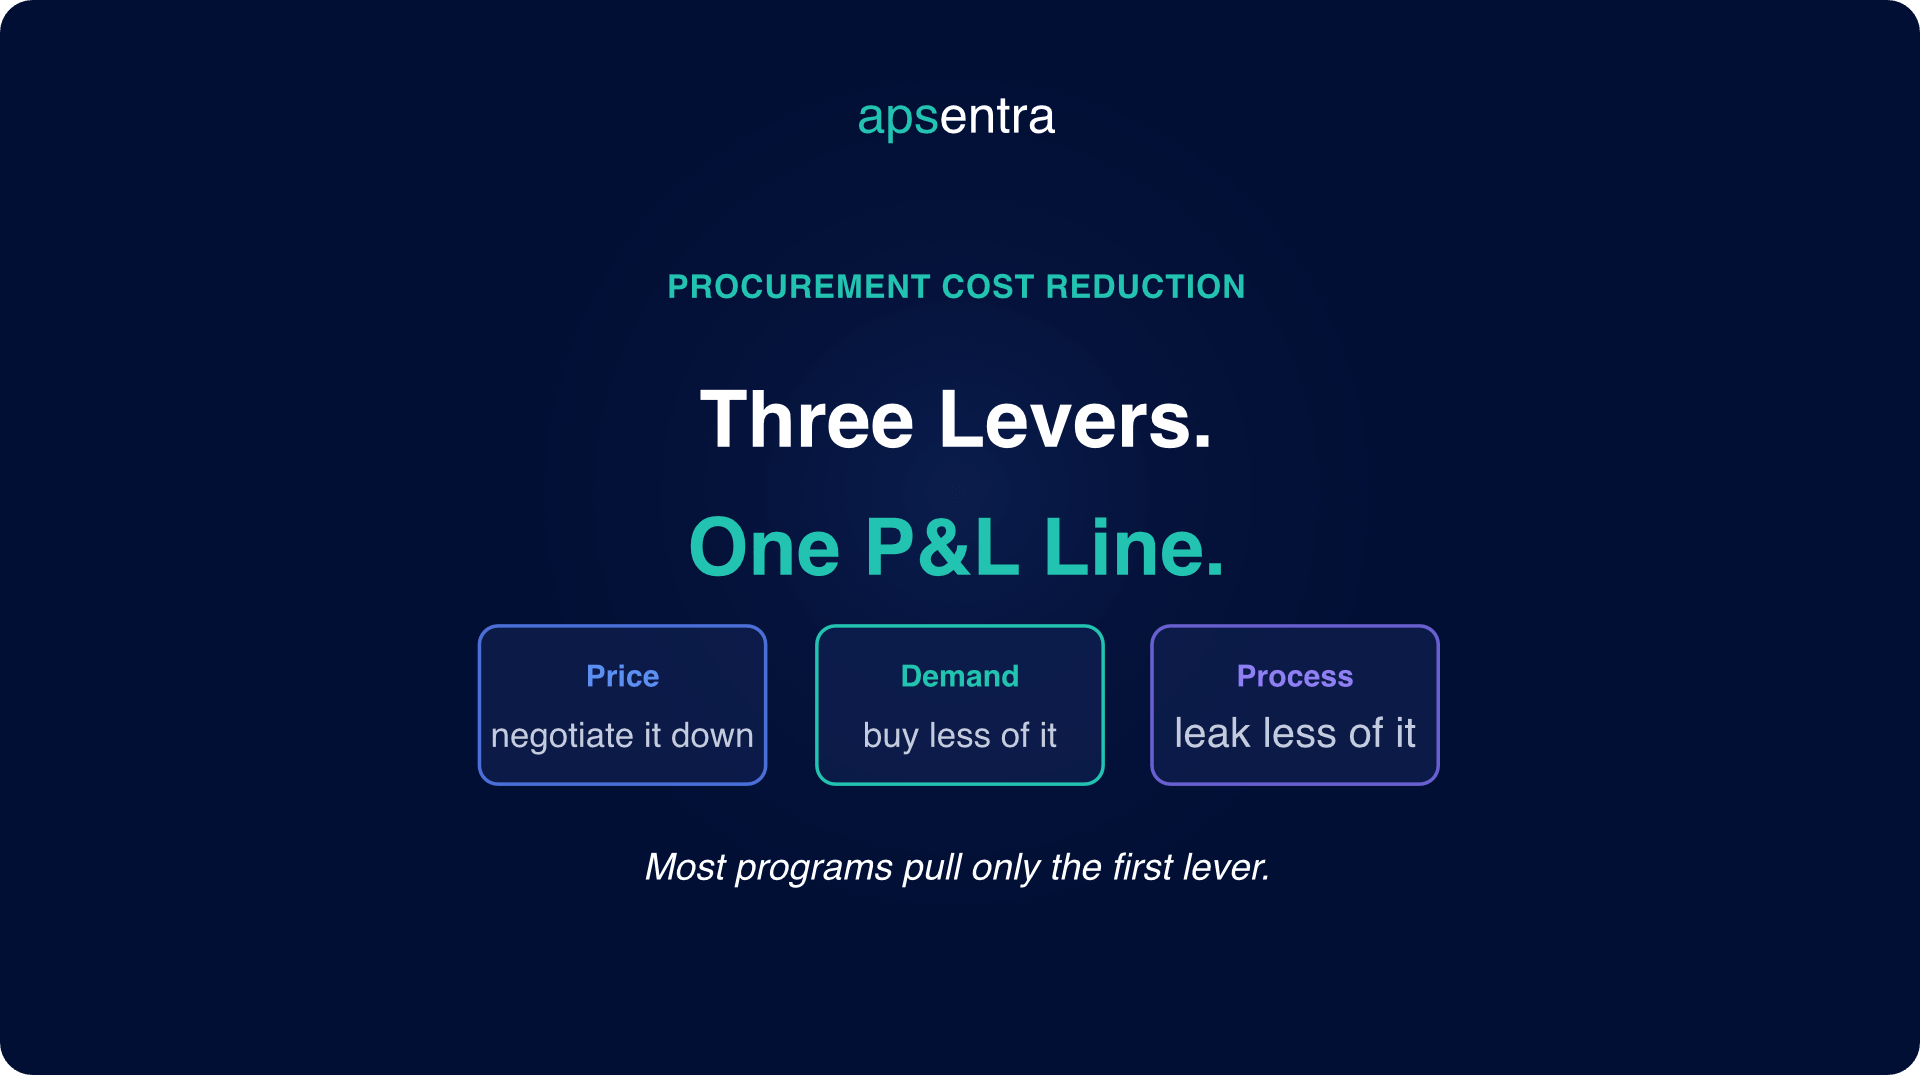
Procurement cost reduction comes from three levers: price, which lowers what you pay per unit through negotiation and competition; demand, which lowers how much you buy through specification control and consumption discipline; and process, which prevents savings already won from leaking back out through noncompliance and unmanaged renewals. Most programs pull only the first.
Price is the lever everyone reaches for first, because it is the most legible. A negotiated rate reduction is easy to explain, easy to put a number on, and easy to present as a win. It is also the lever with the shortest half-life, since market conditions, supplier consolidation, and simple time erode a negotiated rate the moment the ink dries.
Demand is the lever most programs skip, and it is often the largest one available. The cheapest unit of anything is the one never purchased. Tightening specifications, eliminating duplicate tools, right-sizing service levels, and questioning whether a category needs to exist at the volume it currently does routinely outperforms a negotiation on the same spend.
Process is the lever that protects the other two. A negotiated price that nobody enforces at the point of purchase, a specification that gets quietly overridden by a business stakeholder, an auto-renewal clause that fires before anyone reviews it — all of these convert a real savings number into a number that only ever existed in a report.
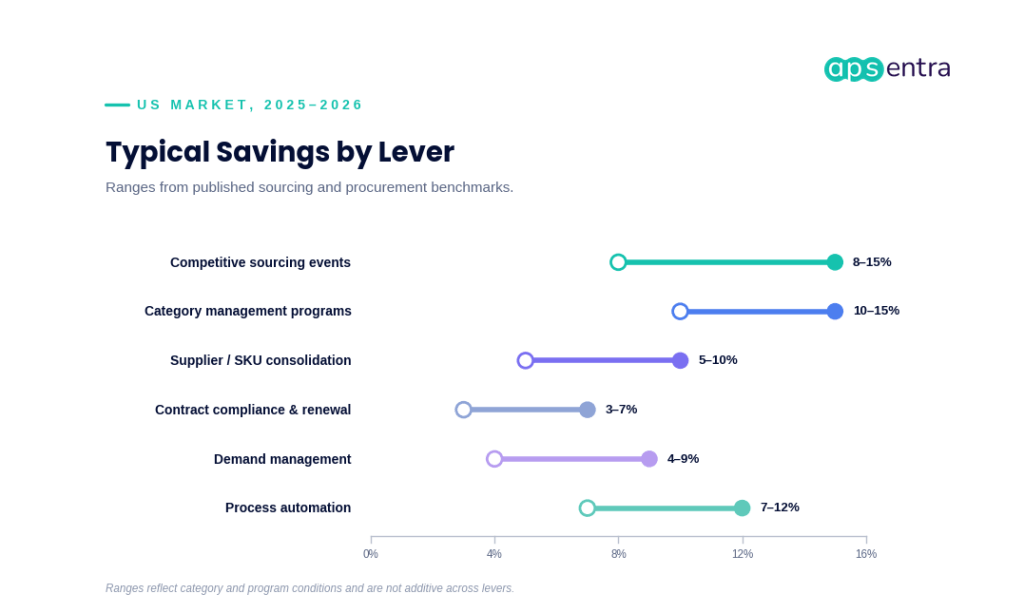
Read the ranges as independent estimates for each lever pulled in isolation, not as a stack that sums to a combined percentage. A category that gets a competitive sourcing event, a demand review, and a compliance tightening in the same year does not capture 8 to 15 percent plus 4 to 9 percent plus 3 to 7 percent. The levers overlap, and the honest combined outcome is closer to the largest single range than to their sum.
Quick Wins vs. Structural Reductions
Every cost reduction program faces the same early pressure: leadership wants a number this quarter, and the categories that produce a number this quarter are rarely the ones with the most money in them.
| Quick wins | Structural reductions | |
|---|---|---|
| Typical source | Renegotiation on an expiring contract, a small consolidation, a maverick-spend redirect | Category strategy, specification redesign, operating model or system change |
| Time to result | Weeks to a quarter | Two quarters to eighteen months |
| Durability | Erodes without a follow-up action; often needs re-capturing annually | Persists once the underlying rule or specification changes |
| Where it shows up | Frequently visible in a monthly savings tracker | Visible in the annual budget baseline, not the monthly tracker |
| Right role in a program | Funds credibility and momentum early | Where the actual multi-year value sits |
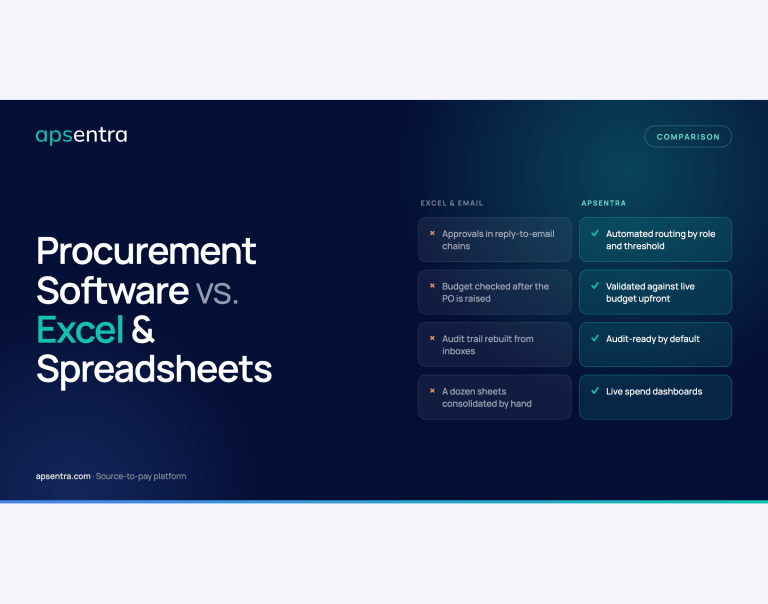
The failure mode is not choosing quick wins. It is stopping there. A program that only ever produces quick wins looks successful on a monthly tracker and never moves the baseline, because nothing about the underlying demand or process actually changed. Quick wins should fund the credibility to run the structural work, not substitute for it.
The size of the gap between the two is well documented. McKinsey’s October 2025 analysis of procurement transformation describes a power generation equipment maker that struggled to manage costs through renegotiation alone until it stood up a dedicated strategic sourcing organization to work directly with engineering on new projects, a structural change that produced an 11 percent cost reduction over twelve months. McKinsey’s broader research across two decades of benchmarking also finds that procurement functions with the strongest operating-model maturity carry an EBITDA margin advantage of five percentage points or more over less mature peers, a gap that quick wins alone do not close.
Sequencing the two together and deciding which categories get which treatment is the core design question in category management consulting, and the make-or-buy version of that same decision, whether a category needs a consultant or a better system, is covered in when your team needs a consultant and when it needs a better system.
Where the Savings Leak Before They Reach the P&L
The gap between a negotiated reduction and a realized one is not mysterious. It concentrates in three predictable places, and none of them require anyone to act in bad faith.
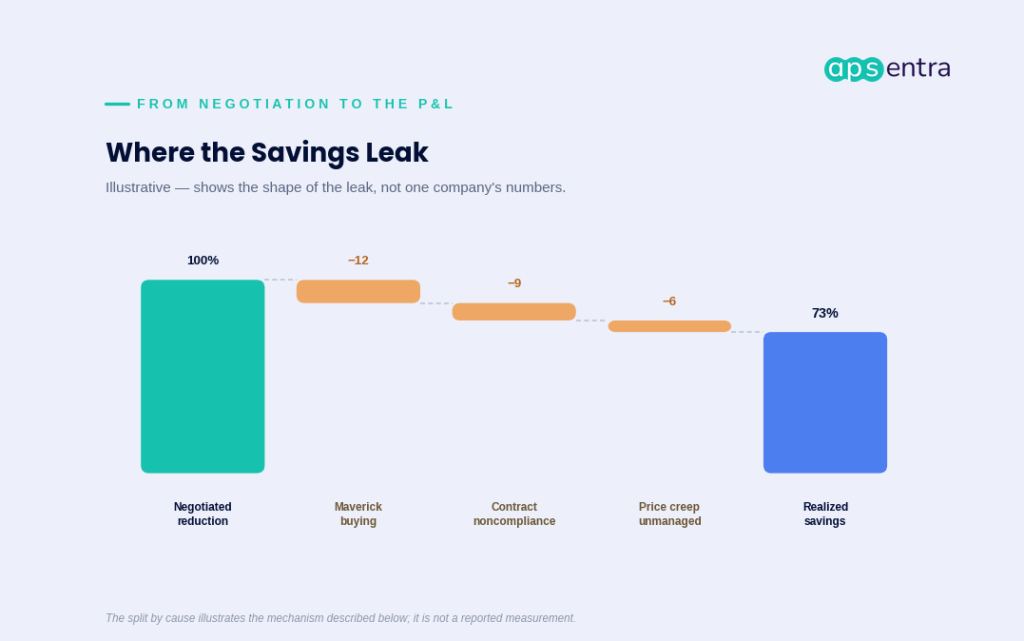

Maverick buying

Contract noncompliance

Unmanaged price creep
The scale of this gap is not a minor footnote. Deloitte’s 2025 Global Chief Procurement Officer Survey found that leading procurement organizations meet or exceed their cost savings targets 96 percent of the time, versus 80 percent for followers, and meet or exceed cost avoidance targets 94 percent of the time versus 75 percent. That gap in target attainment, not a gap in negotiating skill, is what separates a program that reliably delivers from one that reliably disappoints finance.
None of the three leaks are solved by negotiating harder. They are solved by making the negotiated terms the default path rather than a document someone has to remember to consult.
That is the same evidence-and-governance problem covered in our analysis of why procurement ROI fails CFO scrutiny. The controls that close each leak are set out in our procurement audit checklist.
The Capability Gap Behind the Number
The target-attainment gap cited above is a symptom. The cause is a capability difference that shows up across the whole function, not just in one process.
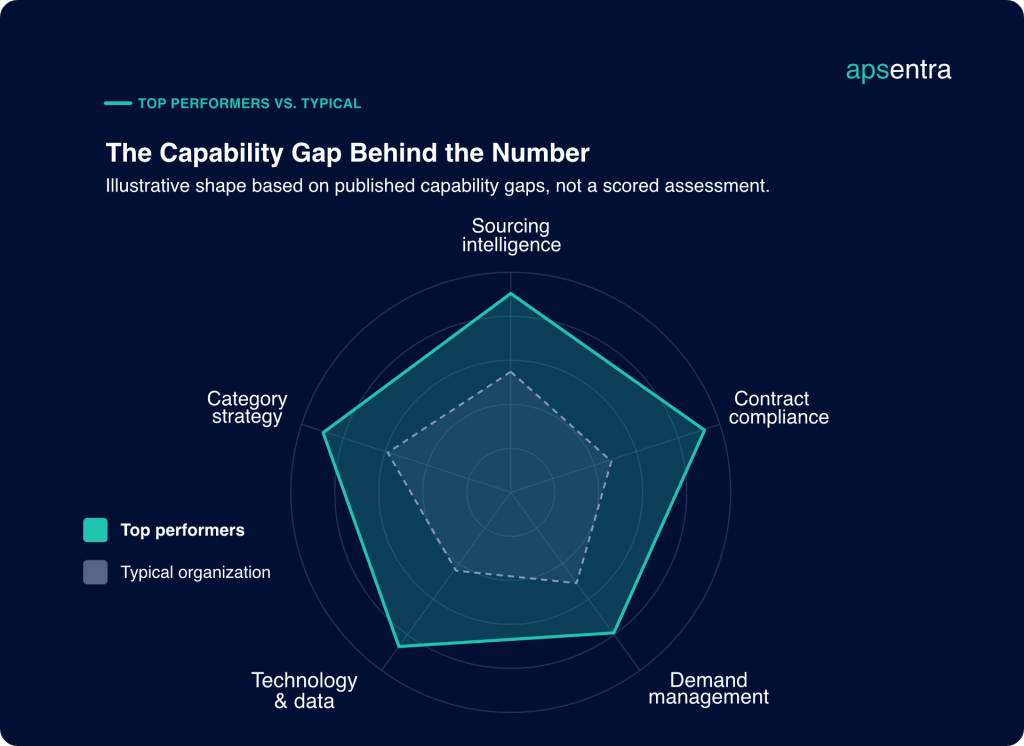
The widest gaps tend to cluster in contract compliance and technology and data, which is consistent with the leakage argument above: top performers are not dramatically better negotiators, they are dramatically better at making a negotiated outcome hold. Sourcing intelligence and category strategy show a real but smaller gap, because that work is more visible and gets more consistent investment even in less mature functions.
The pattern shows up across APSentra client cases, including a state-owned aerospace company that centralized procurement across every operational unit and closed a compliance gap that had been treated for years as a negotiation problem rather than a systems one.
Closing this gap is rarely about hiring stronger negotiators. It is about whether the organization can classify spend accurately, whether an approved contract is enforced at the point of purchase rather than reviewed after the fact, and whether demand decisions are visible before the purchase order is cut rather than after.
Making Savings Stick: Measurement and Governance
A savings program that cannot defend its own number in front of finance will eventually lose funding, regardless of how real the underlying work was.
- Agree the baseline before the work starts. A savings claim is only as credible as the baseline it is measured against, and that baseline has to be fixed before the negotiation begins, not reconstructed afterward to make the number look better.
- Distinguish savings from cost avoidance. A prevented price increase is real value and it is not the same thing as a reduced expense line. Reporting both under one heading is the fastest way to lose finance’s trust in the whole number.
- Track realized, not just identified. A dashboard that stops at the negotiated figure is reporting potential, not performance. The number that matters is what actually moved in the invoices twelve months later.
- Assign an owner to the hold, not just the win. Someone has to be accountable for a savings figure still being true in month nine, which is a different job than the person who negotiated it in month one.
Public disclosures give a useful outside view of what disciplined tracking looks like. Otis Worldwide’s 2025 annual report describes its multi-year “UpLift” program, which combines supply chain procurement improvements with broader operating-model changes and reports both a run-rate savings figure, approximately $200 million annualized, and the actual pre-tax savings realized in the year, approximately $70 million. Publishing both numbers side by side, rather than only the larger run-rate figure, is itself a form of the identified-versus-realized discipline this section is arguing for.
This is fundamentally a finance-procurement alignment problem before it is a reporting-template problem, covered in procurement as a finance function: the CFO-CPO alignment imperative, and the sourcing-side discipline that produces a defensible baseline in the first place is covered in strategic sourcing consulting. Where the underlying capability gaps sit organizationally is a question the procurement maturity assessment and procurement capability assessment are built to answer.