MRO Spend Management: Controlling the Category That Grows Without Your Output
Maintenance, repair, and operations spend has a particular way of getting away from a company. No single purchase is large enough to require a conversation, so nobody has one. The category grows by a few thousand transactions a year rather than by one bad contract, which means it never shows up as a decision anyone made.
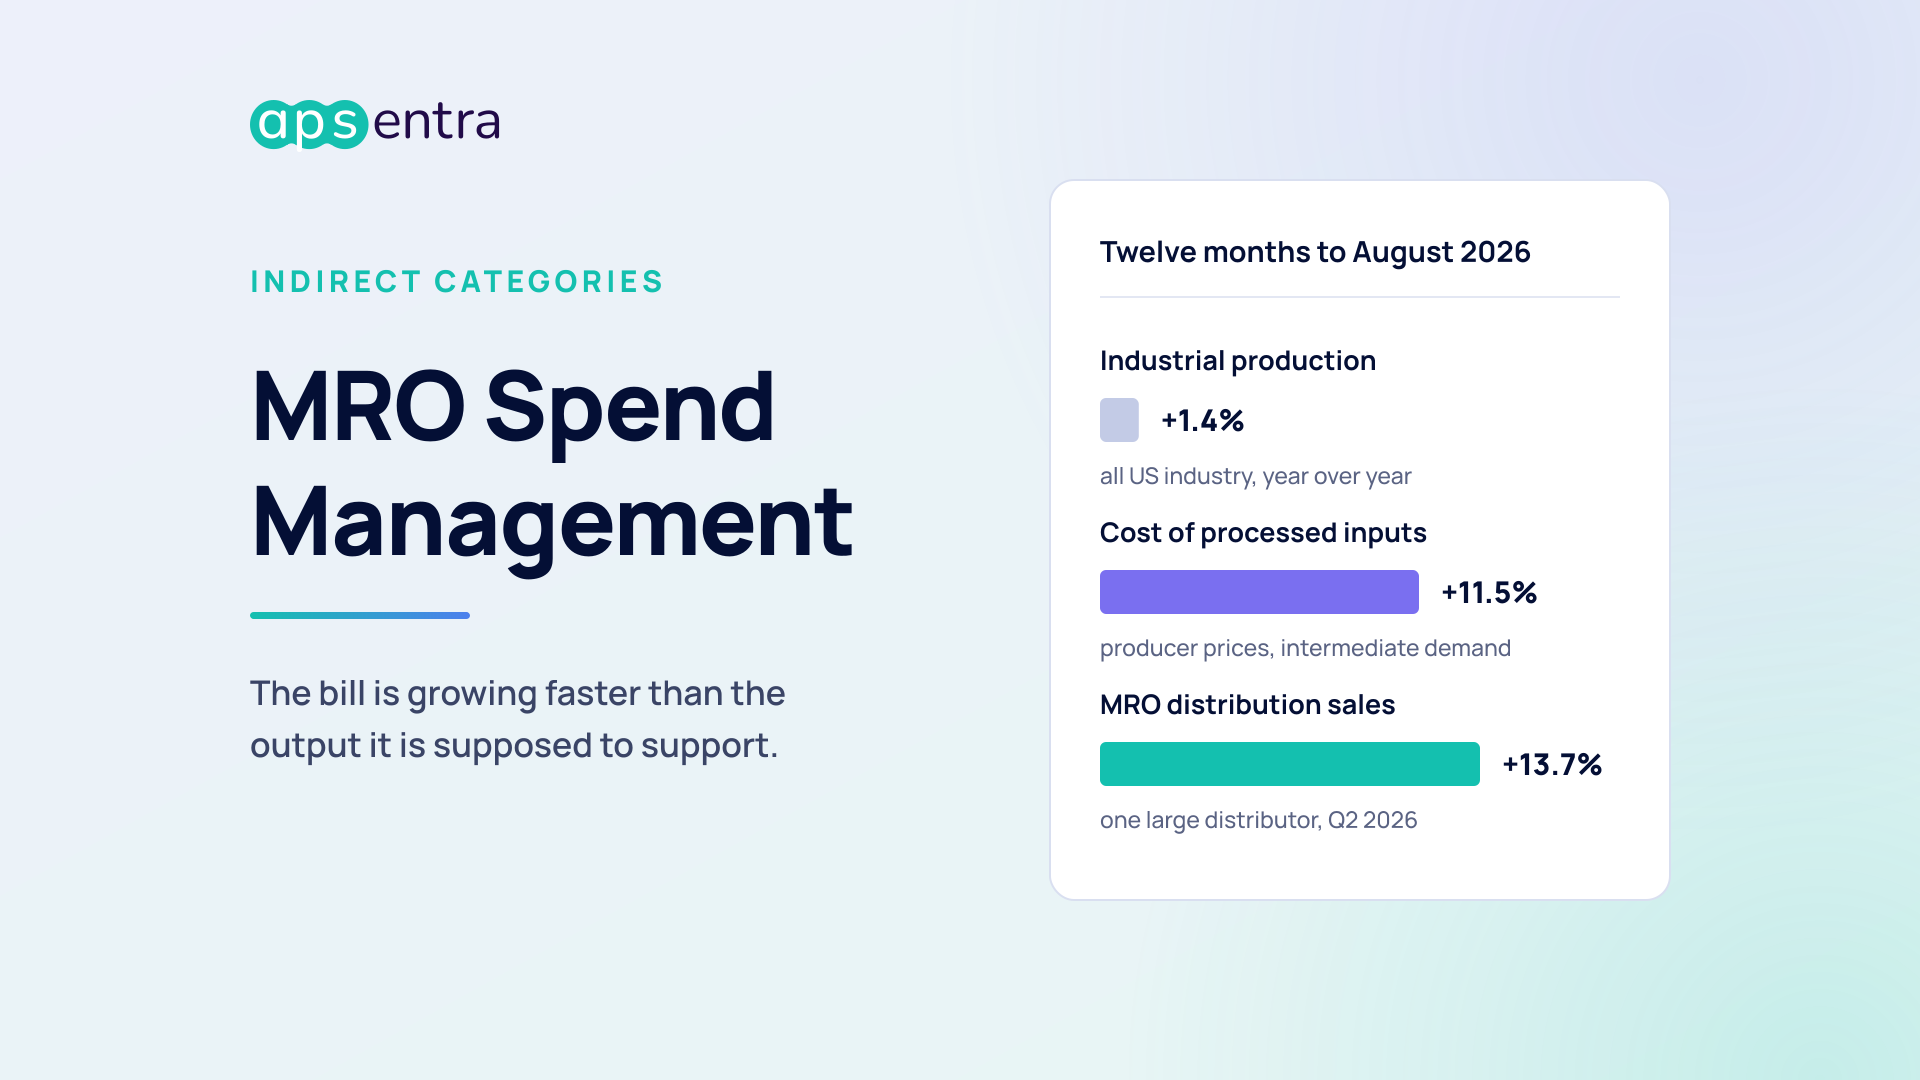
In 2026, that has become harder to ignore, because the bill is now growing on its own. US industrial production in August was 1.4 percent above a year earlier. Over the same twelve months, the producer price index for processed goods that feed into production rose 11.5 percent. Output barely moved. The cost of keeping it running did.
What MRO spend management covers
MRO spend management is the discipline of controlling what a company spends to keep its assets and facilities running: spare parts, consumables, tooling, lubricants, safety supplies, shop supplies, and the outside labor that installs or repairs them. It sits across three things that are often managed by three different people.
- What gets bought. Item definitions, catalogs, approved suppliers, and contracted prices. This is where duplicate records and off-contract buying live.
- How it gets bought. Requisition routes, approval thresholds, purchase order volume, and the labor cost of a transaction. This is usually the highest hidden cost in the category.
- What gets held and consumed. Storeroom stock, min-max settings, obsolescence, and whether consumption is recorded against the asset that consumed it.
Two distinctions are worth making up front. MRO spend management is not maintenance management: the maintenance system decides what work happens and when, while spend management decides what that work costs to supply. And it is not the same as sourcing the category. Sourcing negotiates the price on a line. Spend management changes how many lines there are, who can raise them, and what each one costs to process.
The 2026 picture: the bill is outrunning the output
The Federal Reserve’s industrial production release of September 18, 2026 put total industrial production in August 2026 at 1.4 percent above its year-earlier level, with manufacturing capacity utilization at 75.7 percent, below its long-run average of 78.2 percent. Plants, in aggregate, are not running harder than they were.
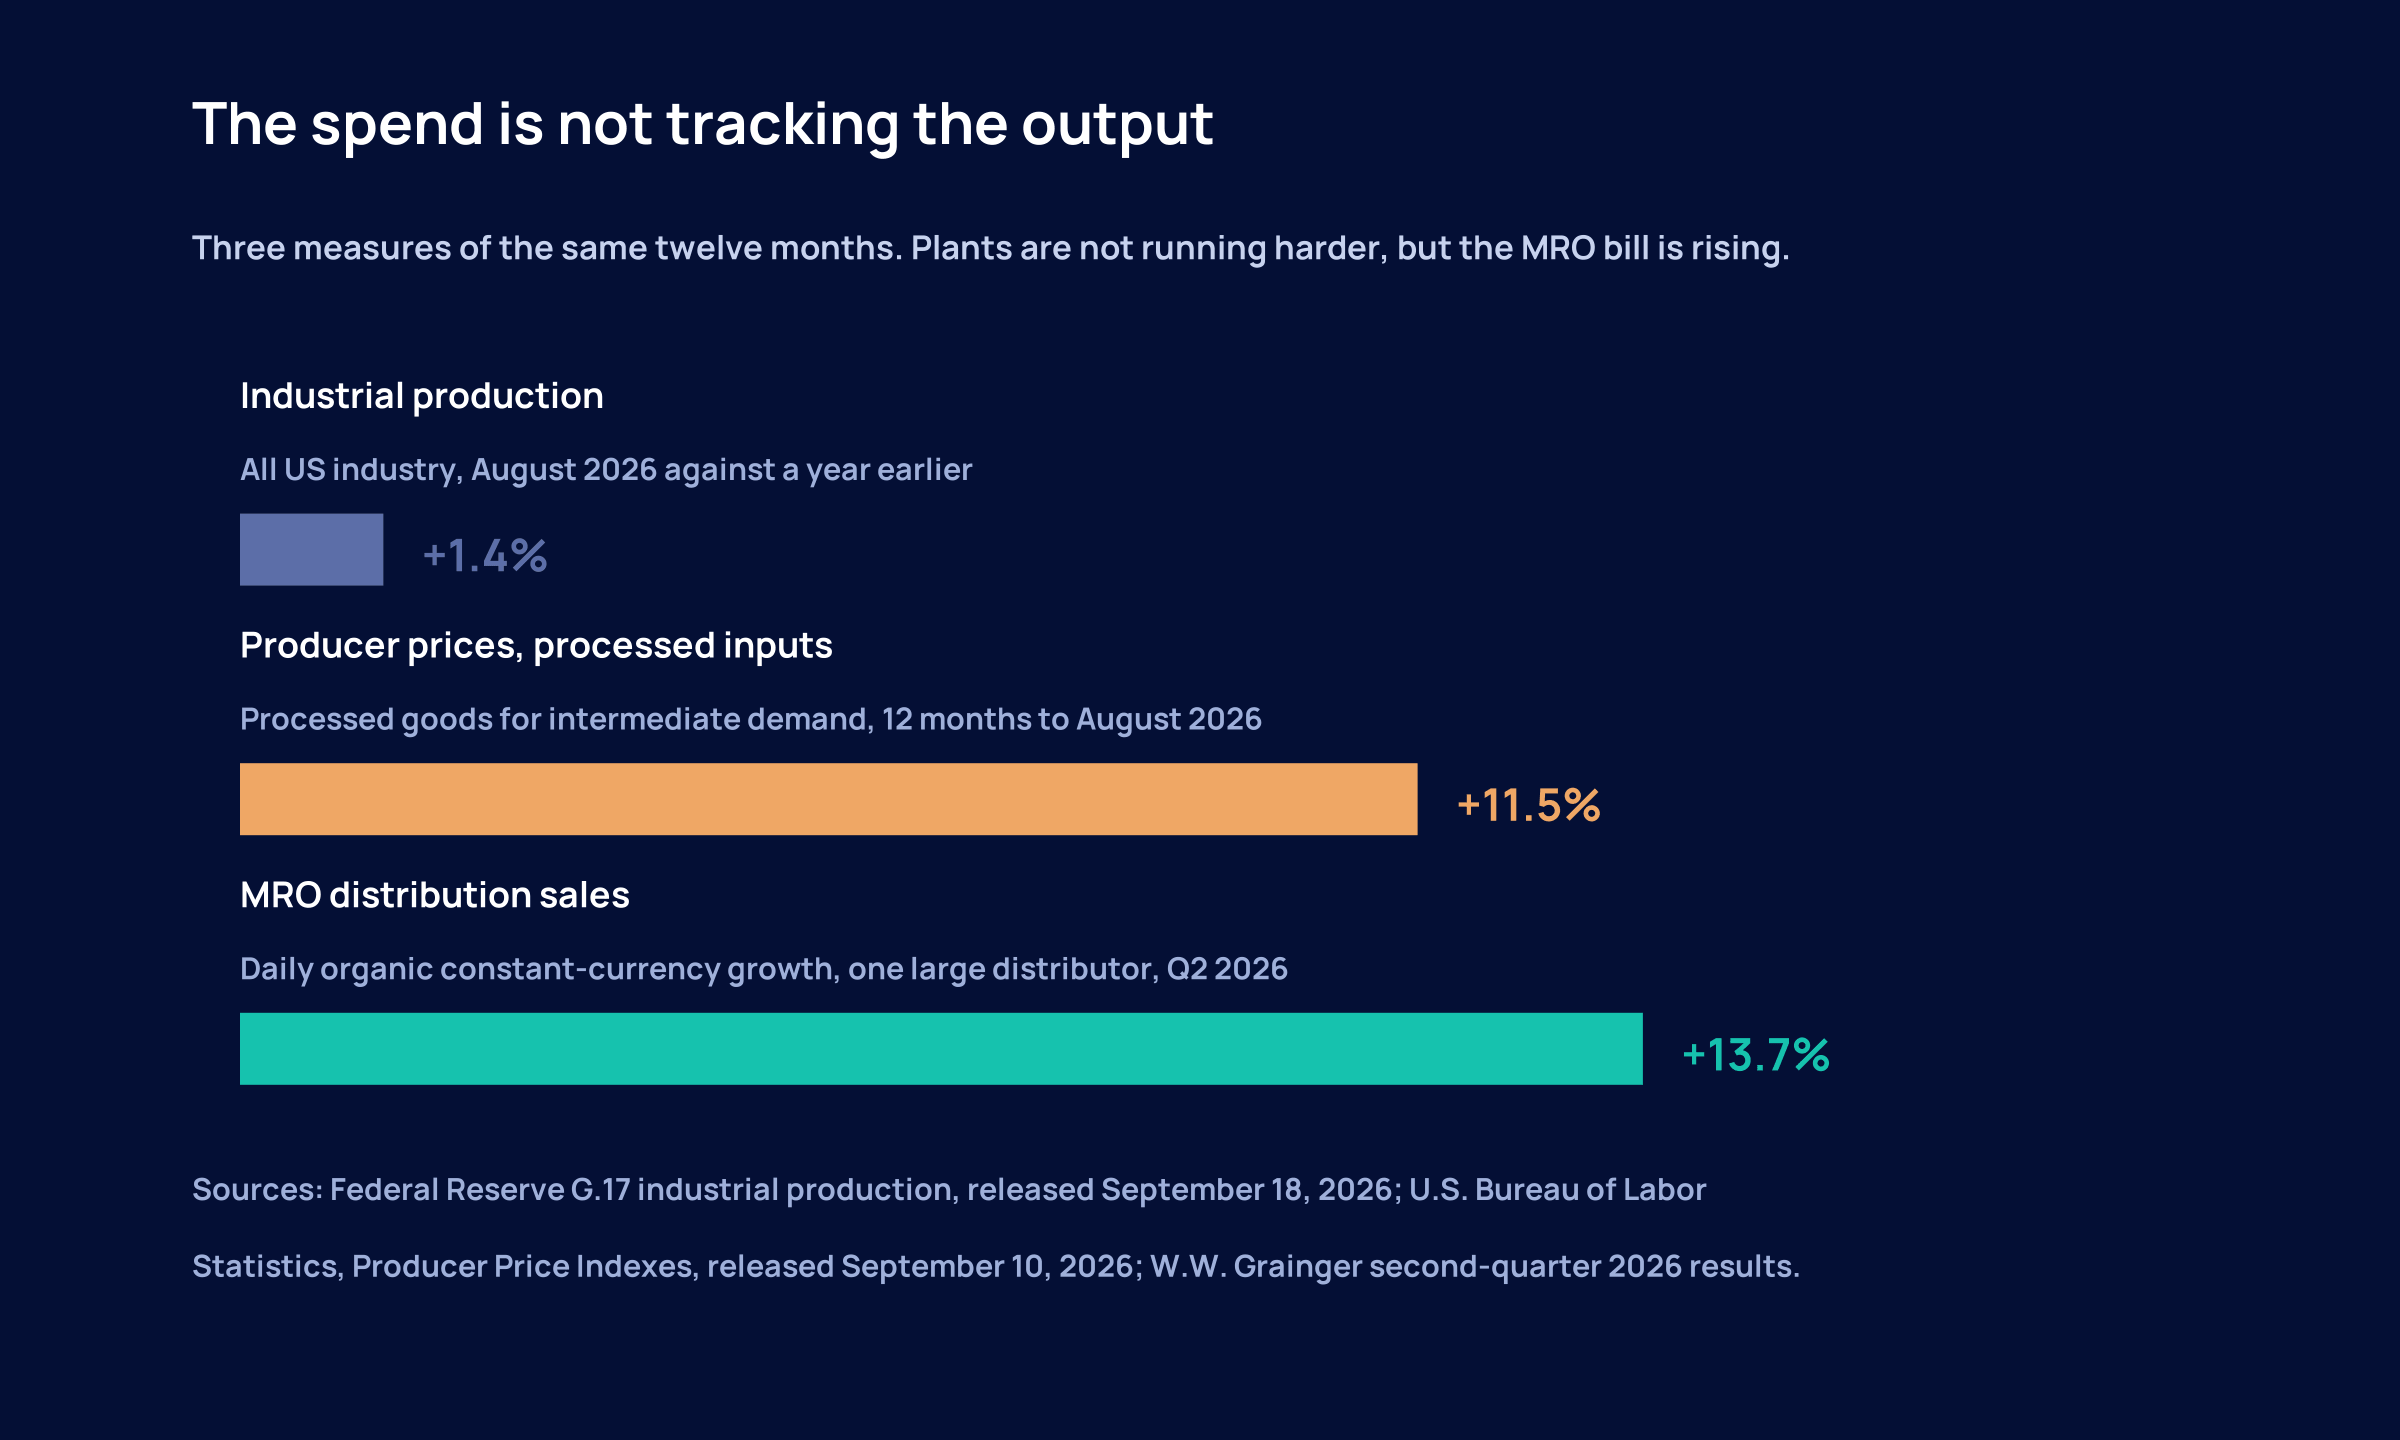
Against that, the cost side moved a long way. The Bureau of Labor Statistics reported on September 10, 2026 that processed goods for intermediate demand rose 1.8 percent in August alone and 11.5 percent over twelve months. Within final demand goods, diesel fuel rose 24.1 percent in the month and accounted for more than a third of the goods increase, while truck freight rose 2.0 percent. Diesel and freight are not incidental to MRO. They are the delivery cost on a category that is bought in small quantities, often urgently.
The distribution channel tells the same story from the other side. W.W. Grainger reported second-quarter 2026 net sales of $5.0 billion, up 10.3 percent, with daily organic constant-currency growth of 13.7 percent, and described its North American growth as driven by volume together with price inflation as tariff costs were passed through. One distributor is not the market, and Grainger has been taking share. But a double-digit increase in MRO distribution against roughly flat industrial output is not explained by more machines running more hours.
What is actually driving it
Three things, and only one of them is under a supplier’s control.
- Input and tariff pass-through. The Federal Reserve’s September 2026 Beige Book reported input price pressures notably elevated in manufacturing and construction, with higher prices for energy, transportation, and raw materials, particularly metals and petrochemicals, and tariff-related impacts noted across multiple districts.
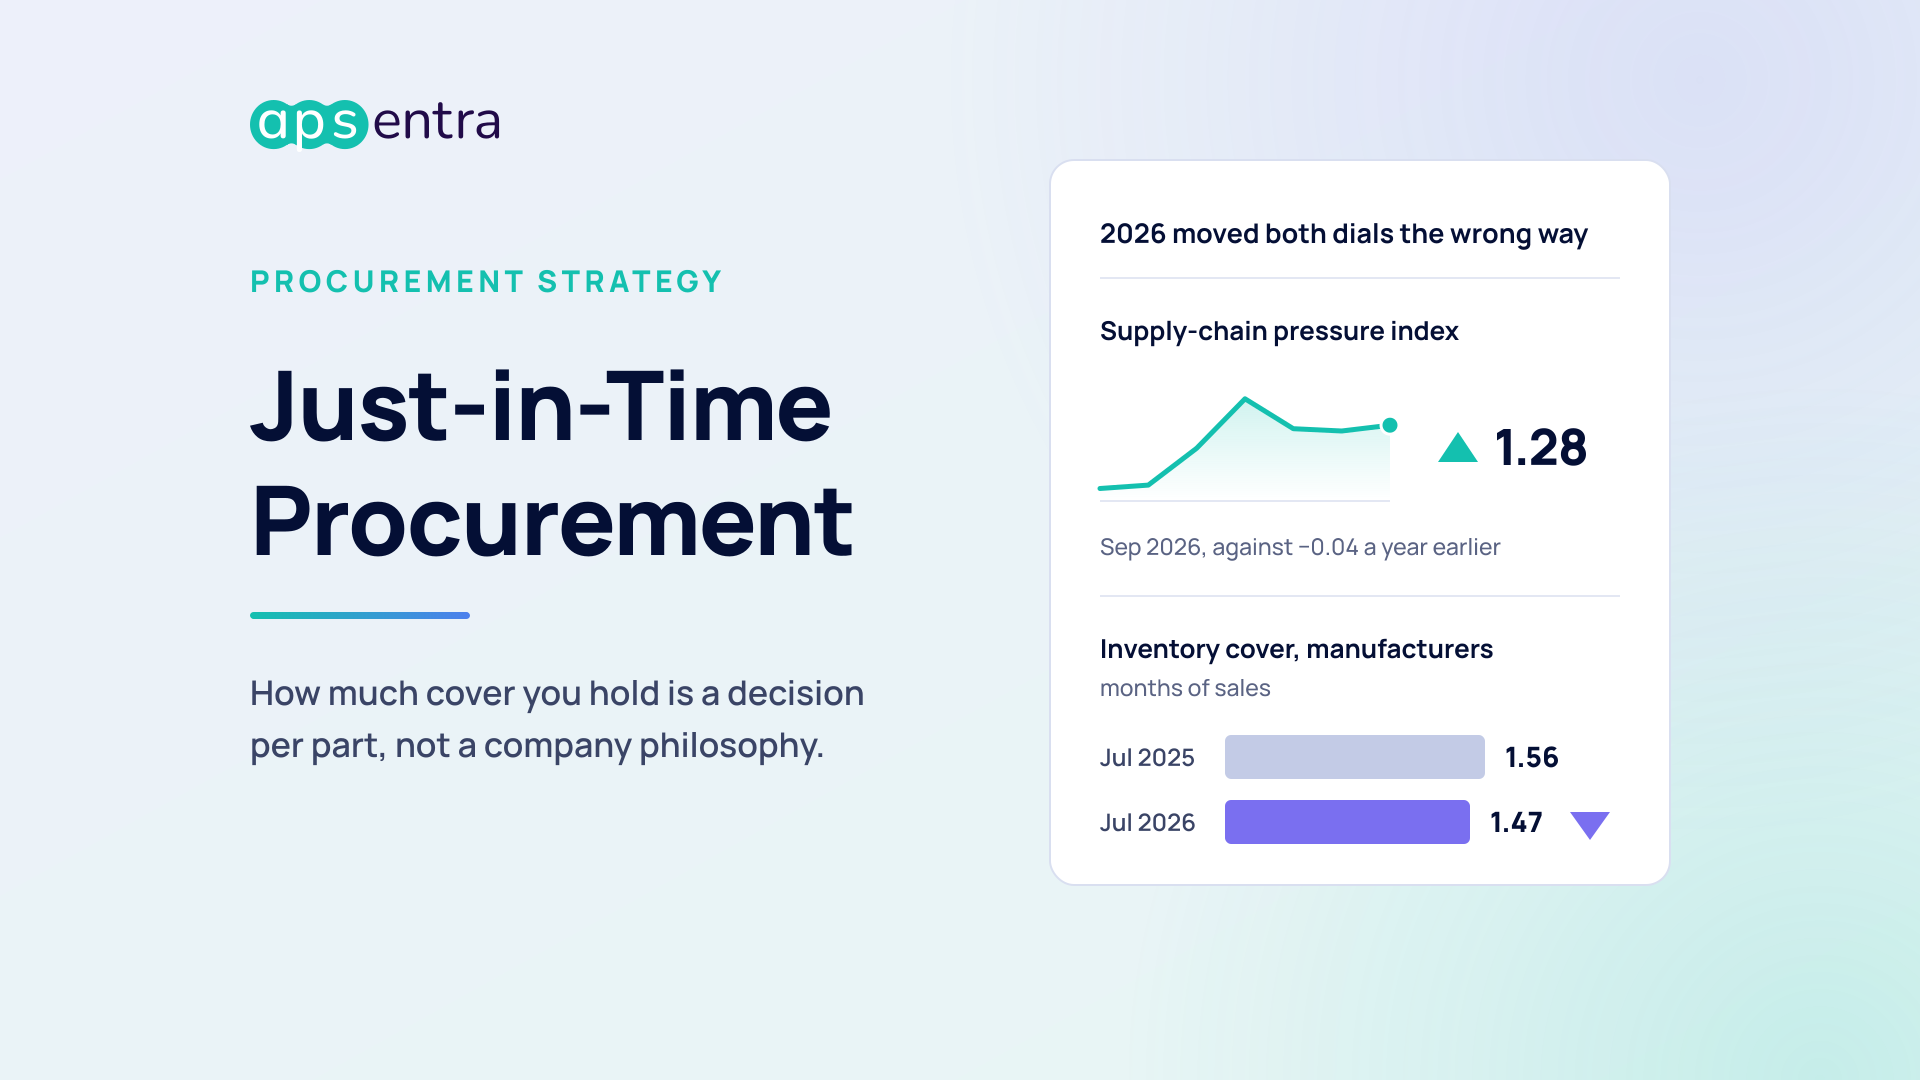
- Thinner inventory in the channel. Merchant wholesalers held an inventories-to-sales ratio of 1.20 in July 2026, against 1.28 a year earlier, per the Census Bureau. If the plan is that the distributor will have it, the distributor is carrying less relative to what it ships.
- Transaction growth nobody is counting. This is the one that is internal, invisible, and usually the largest. Every unmanaged line item carries roughly the same processing cost as a managed one.
Why MRO resists ordinary sourcing
The standard sourcing playbook assumes that effort scales with value: find the big spend, run an event, sign a contract, book the savings. MRO breaks that assumption because value and work are distributed in opposite directions.
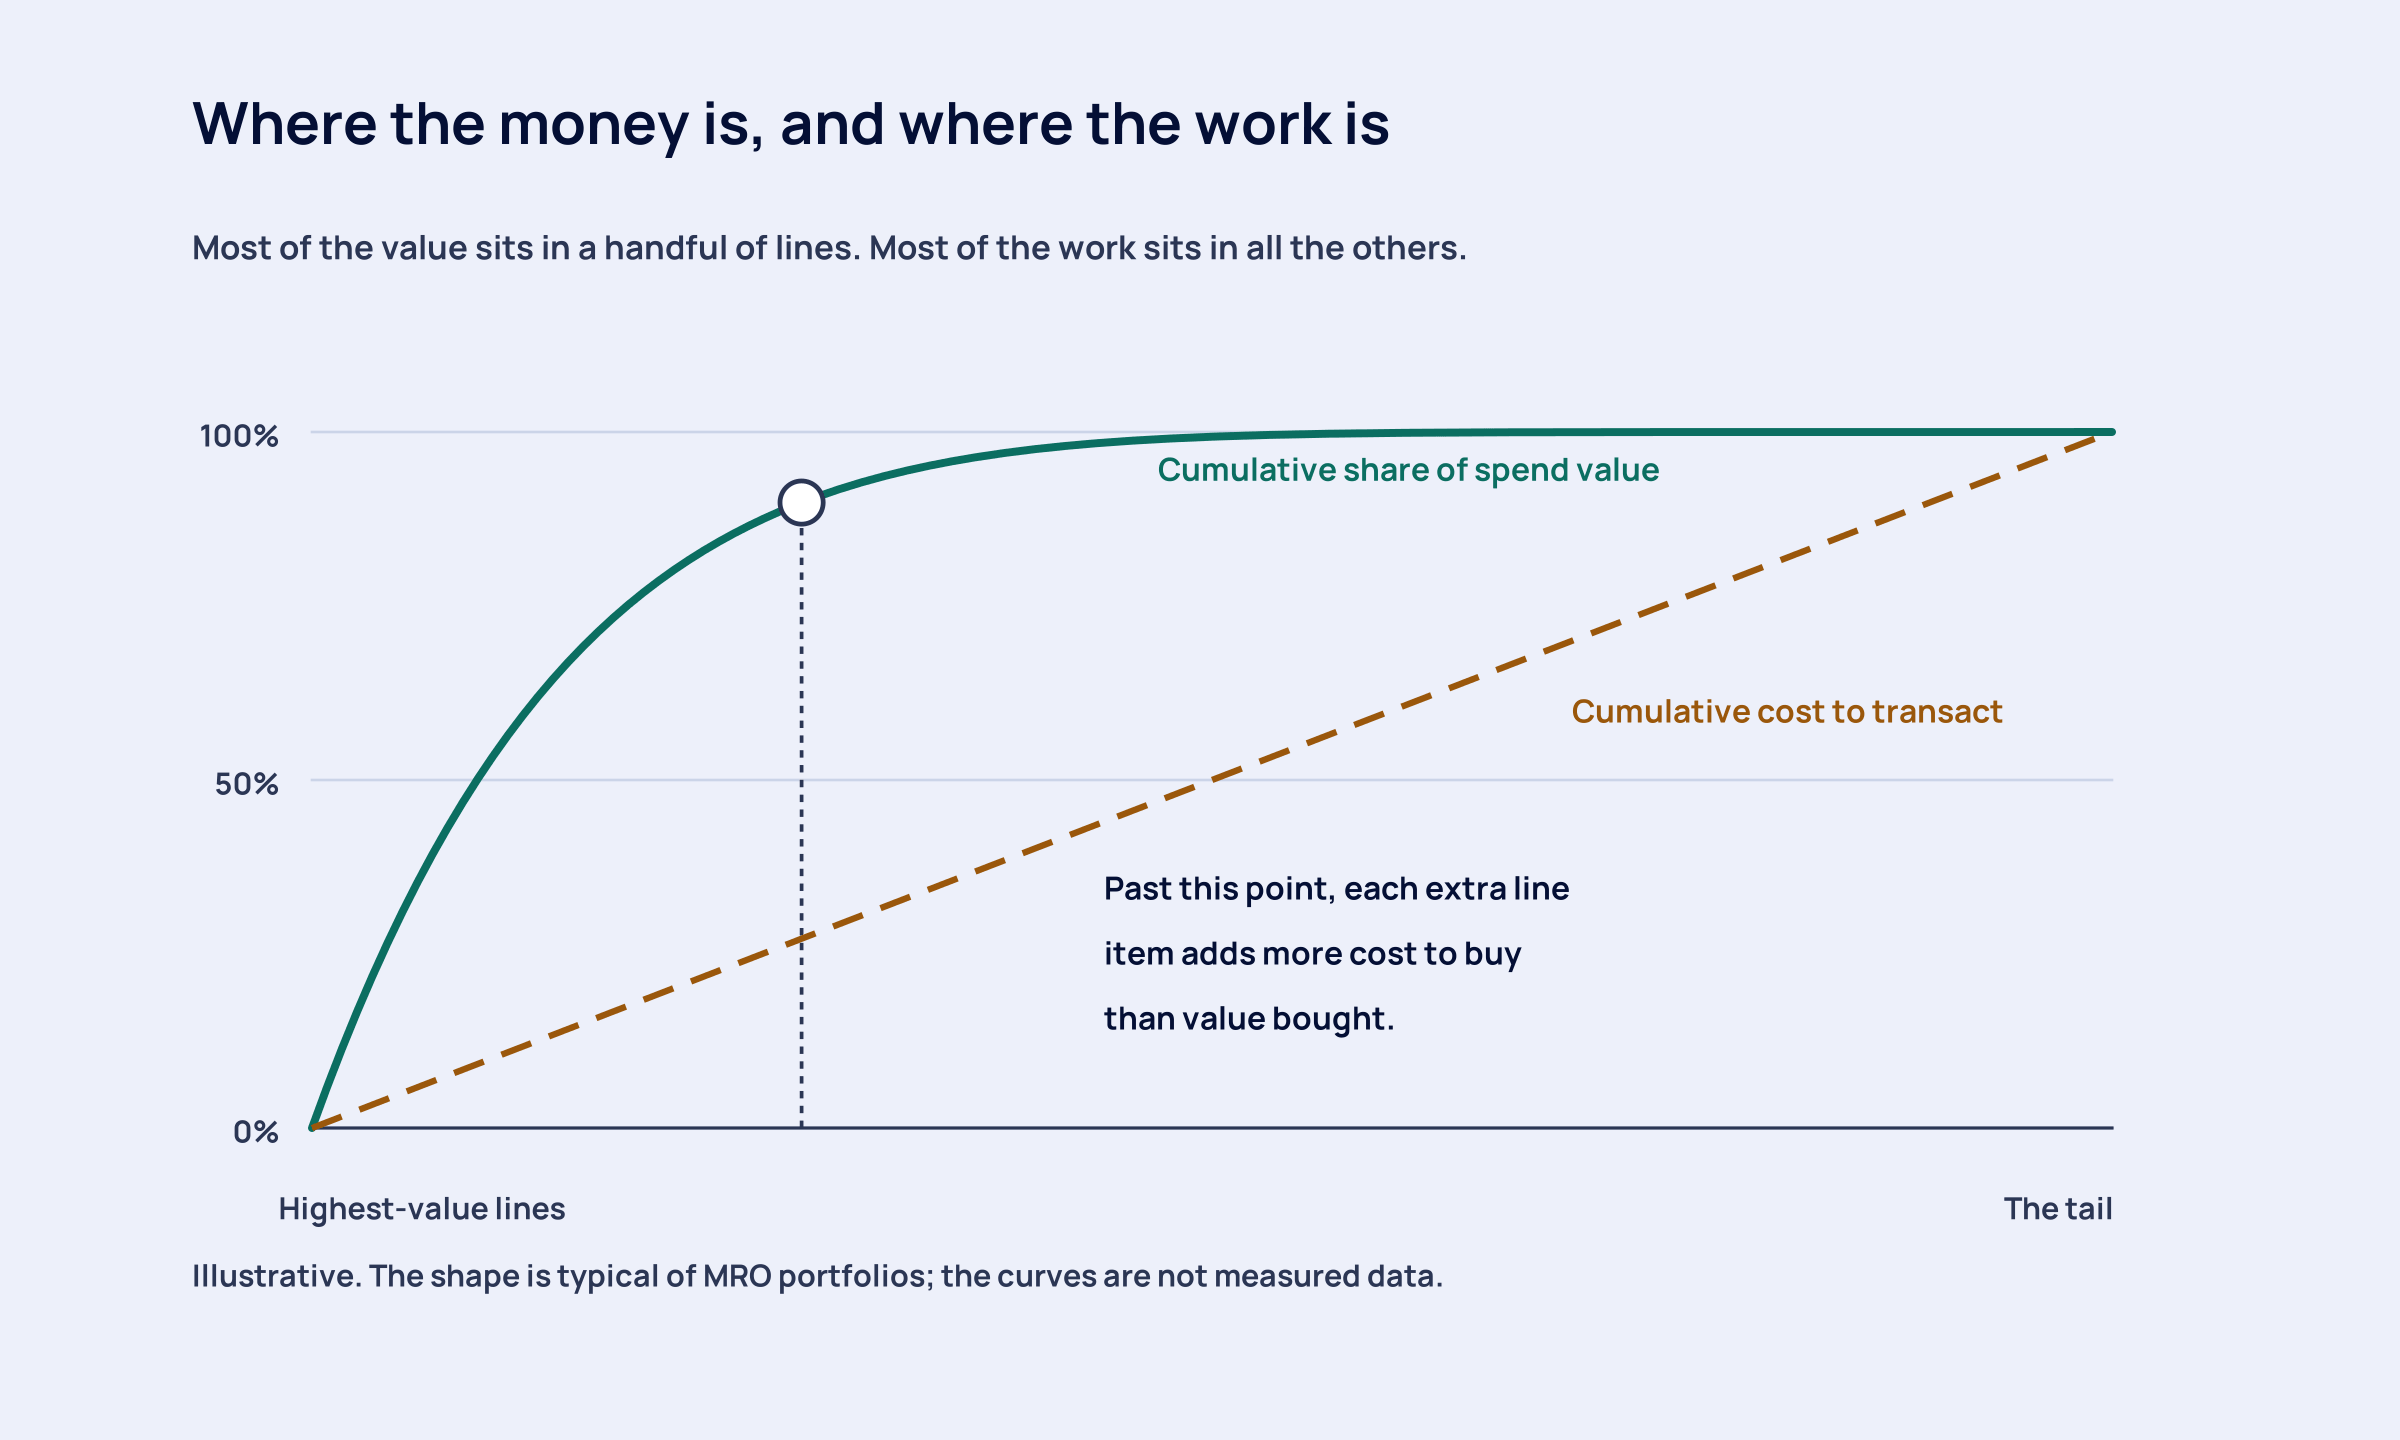
A small number of items carries most of the money. A very large number of items carry most of the purchase orders, most of the approvals, most of the receipts, and most of the invoice exceptions. Past a certain point in the tail, the labor of buying an item approaches or exceeds what the item costs. No price negotiation fixes that, because the cost is not in the price.
This is why MRO programs that start with a sourcing event usually stall. The event addresses the head of the curve, where the money already has some attention, and leaves the tail exactly as it was. Six months later, the reported savings are real, and the total category spend has not moved, because the tail grew while the head was being negotiated.
The item master is the first lever, not the last
Almost every MRO problem downstream is a data problem upstream. The same part arrives in the item master under several records, created at different times by different people with different naming habits, and from that moment it is several parts as far as every system is concerned.
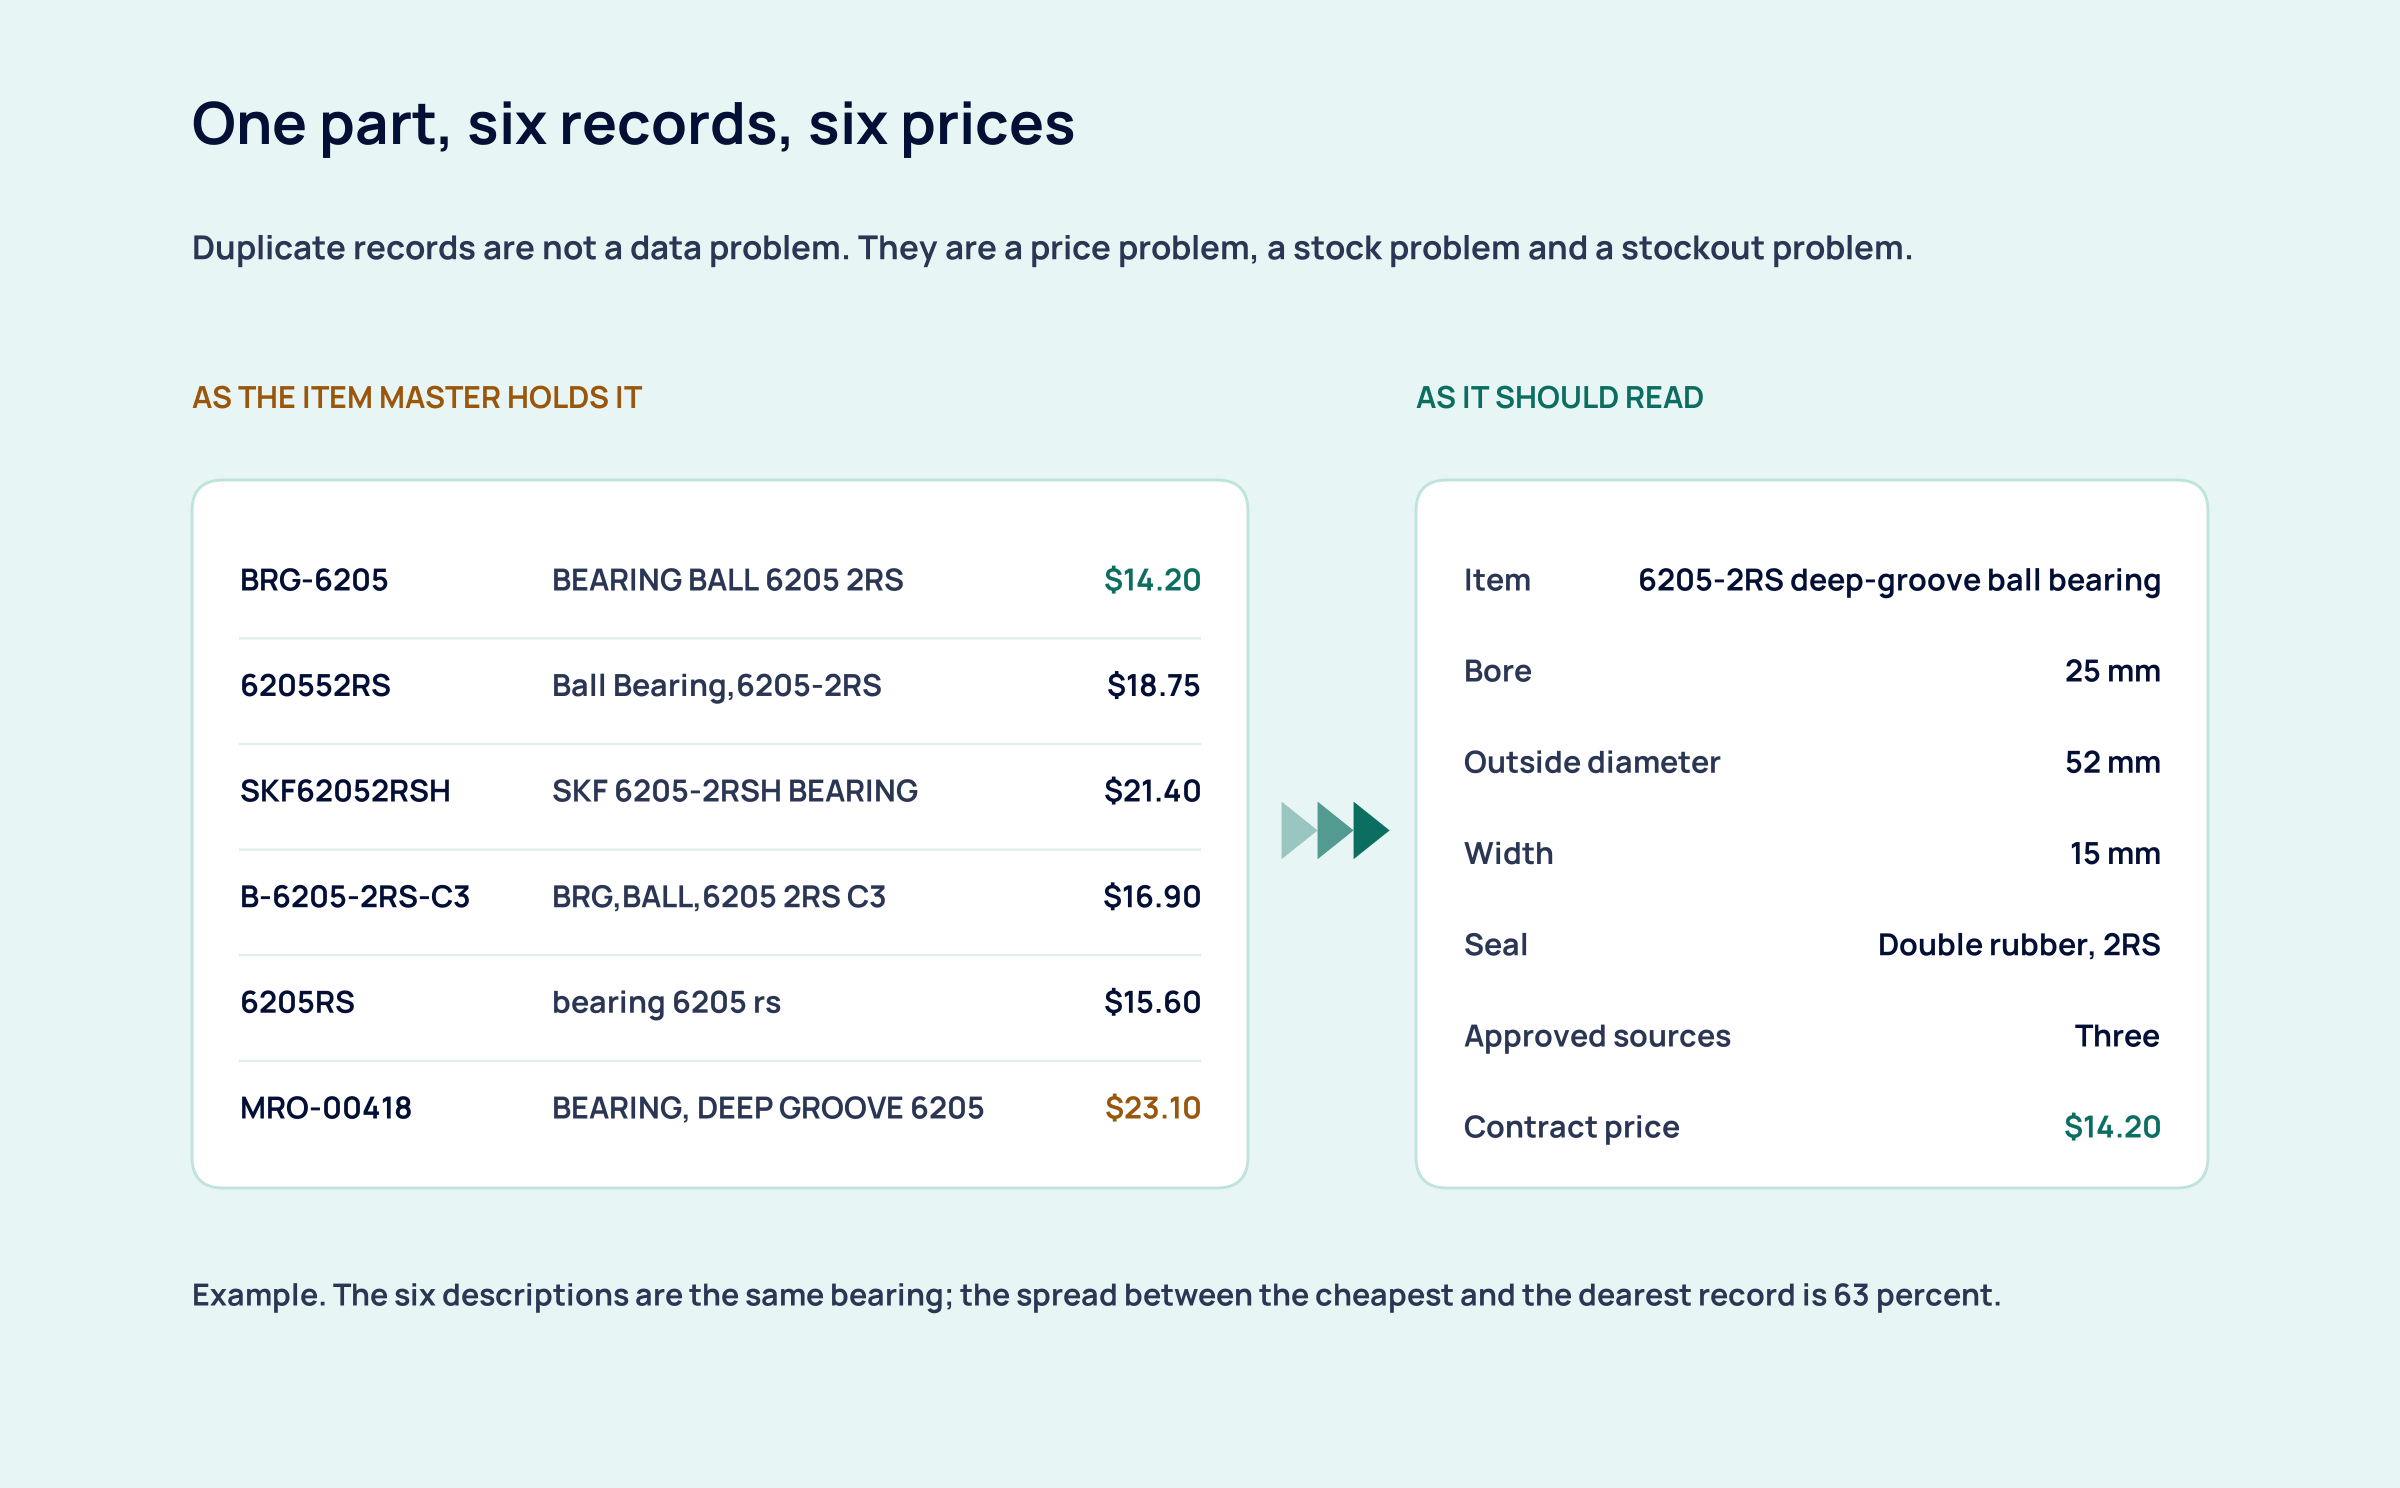
Duplicate records are not a tidiness issue. They cost money in five specific ways:
- Price drift. The same item is bought at several prices because no record shows what it should cost.
- Duplicated stock. The storeroom holds the same part in multiple bins under multiple numbers, and the total on hand looks lower than it is.
- False stockouts. A technician searches one description, finds nothing, and raises an emergency order for a part that is sitting on a shelf twenty feet away.
- Lost leverage. Spend that would be material if consolidated is invisible because it is spread across six line items and three suppliers.
- Dead obsolescence. When an asset is retired, nobody can identify every record tied to it, so the stock stays on the books.
Normalizing the item master means a consistent description structure, attributes that are searchable the way a technician would search, a manufacturer part number where one exists, and a single record per physical item. It is unglamorous work, and it is the precondition for everything else: you cannot catalog, consolidate, or set a sensible min-max on records you cannot match. Automated matching has become good enough to carry most of this, which is covered in more detail in AI in MRO procurement.
Five controls, and what each one stops
Once the data is matchable, the controls that move the number are mostly structural rather than commercial. None of them is a negotiation.
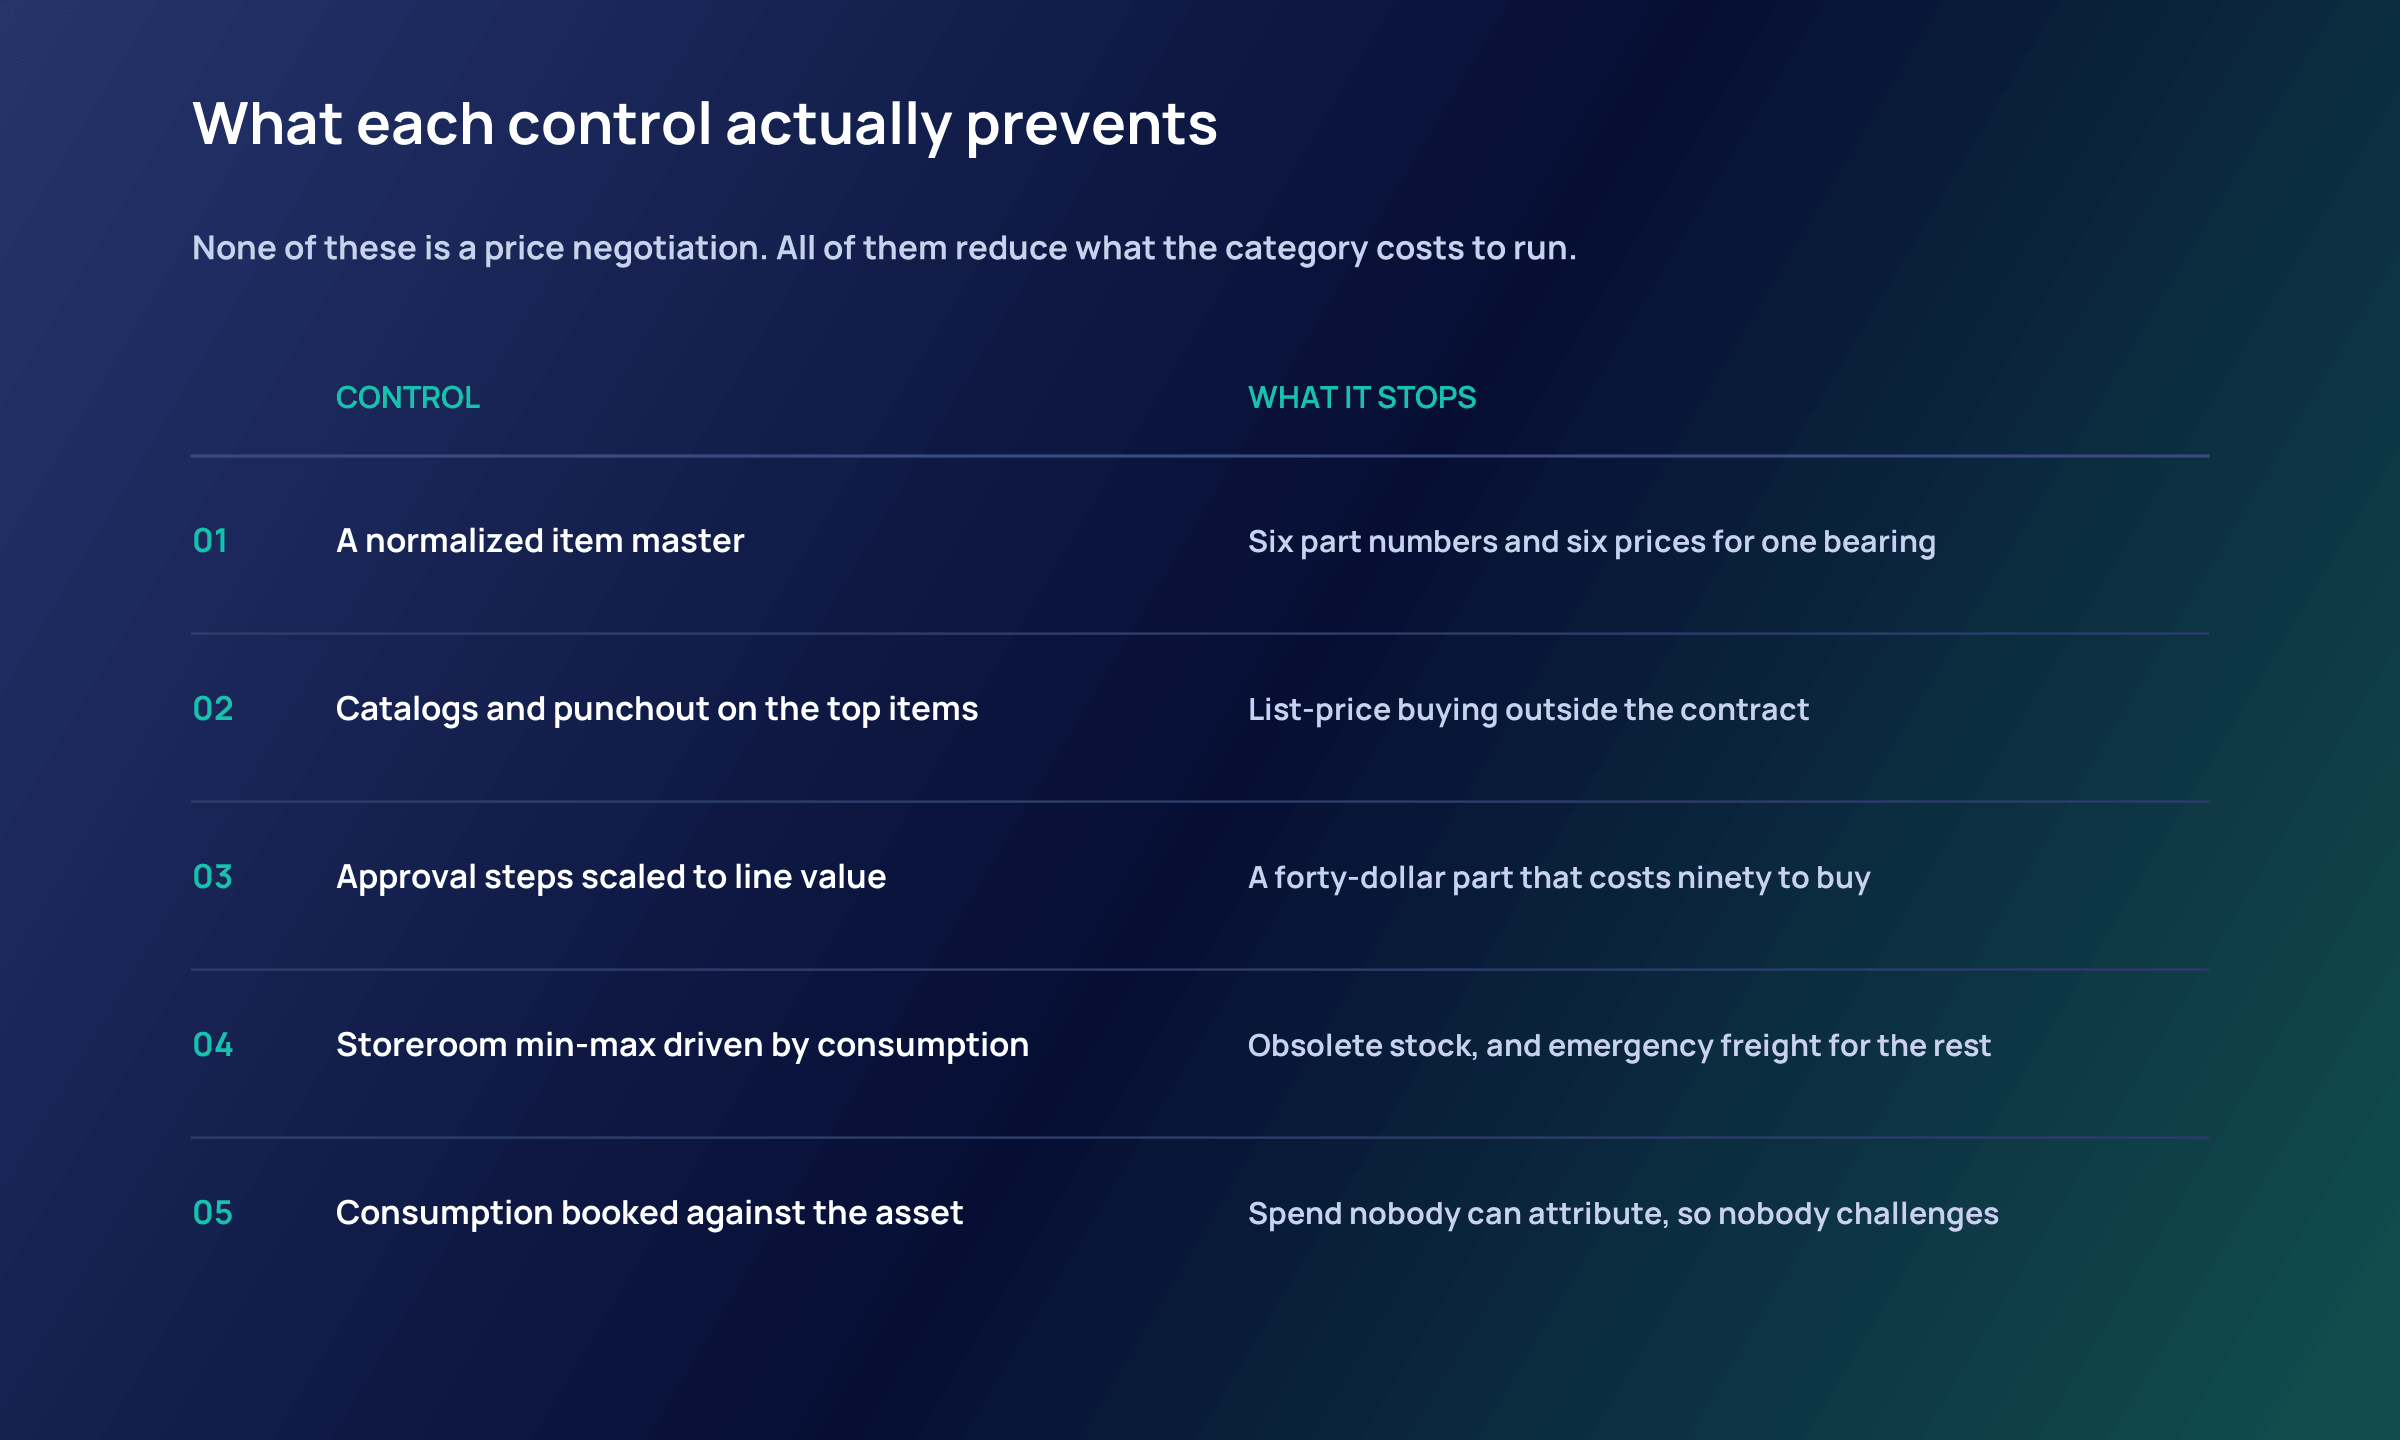
Catalogs sized to actual demand
A catalog covering the items that account for most of the lines, not most of the value, is what pulls buying back onto contract. The test is coverage by transaction count: if sixty percent of requisition lines can be satisfied from the catalog, off-contract buying drops without anyone enforcing a policy. If the catalog is built around the top spend items instead, it will cover a large share of the money and almost none of the orders.
Approval steps scaled to line value
A three-step approval on a forty-dollar item is a loss-making control. It consumes more supervisor and buyer time than the item costs, and it is the main reason people buy around the system. Set thresholds so that low-value catalog lines flow through on a single confirmation, and reserve real scrutiny for non-catalog items, new suppliers, and anything above a value that matters.
Consumption recorded against the asset
Spend that is booked only to a cost center cannot be questioned, because nobody can tell whether a pump consumed four seals this year or fourteen. Recording issues against the asset turns MRO spend into something maintenance and finance can both read, and it is what makes a repair-versus-replace argument possible at all.
The storeroom is part of the spend
Many companies manage MRO purchasing and MRO inventory as separate problems, and the gap between them is where a large share of the waste sits. The storeroom is the physical record of every buying decision that was made without a consumption signal.
| What to look at | What it usually reveals | What to do about it |
|---|---|---|
| Items with no issue in 24 months | Stock bought for an asset that has changed or been retired | Identify the asset link, then write off or return what is genuinely dead |
| Min-max set at creation and never revised | Cover based on a guess made once, not on what the part actually does | Reset from issue history and the supplier’s recent lead times |
| Emergency orders for stocked items | A search problem, not a stock problem, usually caused by duplicate records | Fix the item description, not the min-max |
| Critical spares with no second source | A single point of failure that the min-max cannot protect against | Qualify an alternate or contract for availability |
| Consignment and vendor-managed lines | Stock the supplier owns but nobody is reconciling | Reconcile on-hand against billed consumption every quarter |
The most common mistake here is cutting the storeroom before fixing the data. Removing stock from a system where the same part exists under six records produces exactly the failure mode the storeroom existed to prevent, and the organization concludes, wrongly, that it needs more inventory.
What to measure
MRO is not short of reports. It is short of measures that point at a decision. These six do:
- Lines on contract, by count. Not spend on contract. The two numbers diverge sharply in MRO, and the count is the one that predicts workload.
- Cost per purchase order line. Fully loaded, including requisition, approval, receipt, and invoice handling. Once this exists, most tail-spend arguments settle themselves.
- Duplicate rate in the item master. The share of records that match another record on the same physical item. Track it down, and track it after each data load.
- Emergency and expedited orders as a share of lines. Rising emergency volume is a planning or data failure, not a supplier failure, and the freight premium is the invoice for it.
- Storeroom turns and non-moving value. Turns alone can look healthy while a large block of value has not moved in two years. Report both.
- Supplier count in the tail. How many suppliers account for the bottom ten percent of spend. This is the number that consolidation actually changes.
Most of these already exist in fragments across the purchasing, maintenance, and finance systems. The difficulty is joining a requisition to a receipt to an asset, which is also why the measures tend not to get built. The same joining problem is discussed for direct materials in manufacturing procurement and in the step sequence set out in the manufacturing procurement process.
A sequence that does not stall
MRO programs fail at a predictable point: six months in, when the data cleanup is still running, and nothing has been saved. Sequencing the work so that something lands early is most of what keeps it alive.
- Weeks 1 to 4. Extract twelve months of purchase order lines. Count them. Establish the fully loaded cost per line and the share of lines that are off-contract. These two numbers are the business case.
- Weeks 5 to 10. Normalize the top items by line count, not by value. Match duplicates, set one record per physical item, and record the price spread you find. The spread is the first saving, and it is defensible.
- Weeks 11 to 16. Stand up a catalog over the normalized items and set approval thresholds by line value. Measure catalog coverage by transaction count weekly.
- Weeks 17 to 24. Reset storeroom min-max from issue history. Address non-moving stock only now, once records are matched and consumption is visible.
- Then, and only then. Consolidate suppliers in the tail and renegotiate. By this point you know what you buy, how often, and what it costs to buy, which is the position the supplier assumed you did not have.
Mistakes that keep the category expensive
- Measuring the program on price savings alone. Most of the available money in MRO is in process cost and avoided consumption, neither of which shows up in a price variance.
- Building the catalog around top spend. It covers the money and misses the orders, so off-contract buying continues at the same rate.
- Cutting storeroom stock before matching records. This creates the shortages that discredit the whole program.
- Treating technicians as the problem. People buy around a system that is slower than the job. Fix the search and the approval time, and most maverick buying disappears without a policy.
- Running one cleanup and declaring it done. Duplicate records regenerate at the rate new items are created. Without a creation standard and a gatekeeper, the item master is back where it started in about two years.
What this comes down to
In a year when industrial output moved 1.4 percent, and the cost of processed inputs moved 11.5 percent, the MRO line on a budget was always going to rise. What is controllable is not that increase. It is the share of the category that is bought at an uncontrolled price, processed at a cost greater than the item, held in stock nobody has looked at, or ordered urgently because a record could not be found.
A reasonable first move costs very little: count the purchase order lines for the last twelve months, sort the item master by description similarity, and look at what the top twenty duplicated items are being bought for. The price spread in that single list is usually enough to fund the rest of the work.
Sources
- Federal Reserve, Industrial Production and Capacity Utilization (G.17), released September 18, 2026
- U.S. Bureau of Labor Statistics, Producer Price Indexes, August 2026 (released September 10, 2026)
- W.W. Grainger, second-quarter 2026 results, filed with the SEC on August 4, 2026
- U.S. Census Bureau, Manufacturing and Trade Inventories and Sales, July 2026 (released September 16, 2026)
- Federal Reserve, Beige Book national summary, September 2, 2026